Table of Content
How can you keep your team aligned on KPIs without sending endless email reports? The answer is putting your Power BI dashboards on shared screens where everyone can see them. By connecting your Microsoft account to Look Digital Signage, you can turn a static lobby TV into a live data center in minutes-no coding or complex hardware required.
This setup brings data out of individual laptops and into the physical space. Whether you need to track sales in real-time, monitor logistics, or share production metrics, Look DS makes it easy to publish secure, live reports to one screen or a global network. Here is how to set it up and why it transforms how your team works.
What Is Power BI and Digital Signage?
What Is Power BI?
Power BI is an interactive data and reporting tool from Microsoft that turns raw numbers into clear charts, graphs, and reports. It connects to dozens of data sources-like Excel, Salesforce, Google Analytics, and IoT devices-to give you a complete view of business performance.
The platform consists of three main parts:
- Power BI Desktop - A PC application for preparing data and building reports.
- Power BI Service - A cloud-based SaaS service where you publish, share, and collaborate.
- Power BI Mobile - Apps for viewing dashboards on phones and tablets.
When used effectively, these tools move your organization beyond storing data to actually using it for daily decisions.
How Does Digital Signage Work?
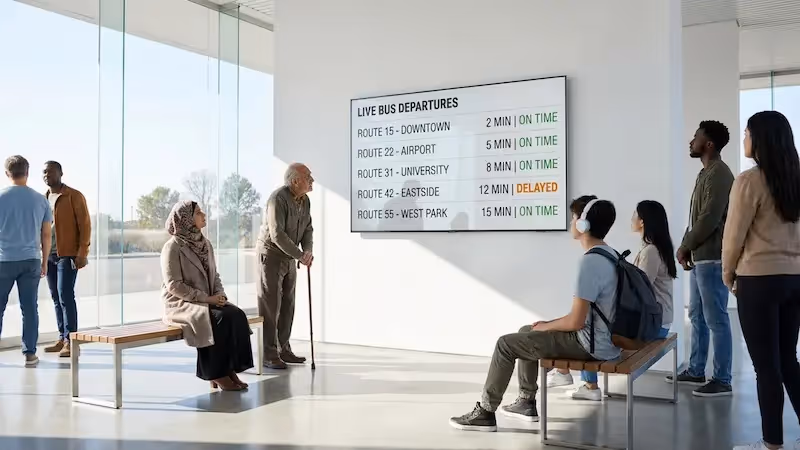
Digital signage is the use of screens-LCDs, LEDs, or tablets-to display content in physical locations. Unlike printed posters, digital signage allows you to schedule messages, play videos, and display live data feeds. It is a "set and forget" communication channel designed to reach employees and visitors where they naturally gather.
A reliable system relies on two components: the hardware (screen and media player) and the software (a Content Management System or CMS). Look Digital Signage (Look CMS) is the software layer that lets you:
- Manage screens remotely from a web browser.
- Build playlists combining images, videos, and dashboards.
- Use smart scheduling to automate when content appears.
This combination is ideal for live metrics because it eliminates manual updates. Once connected, your screens update automatically as the data changes.
Why Display Power BI Dashboards on Digital Signage?
Benefits for Teams and Decision-Makers
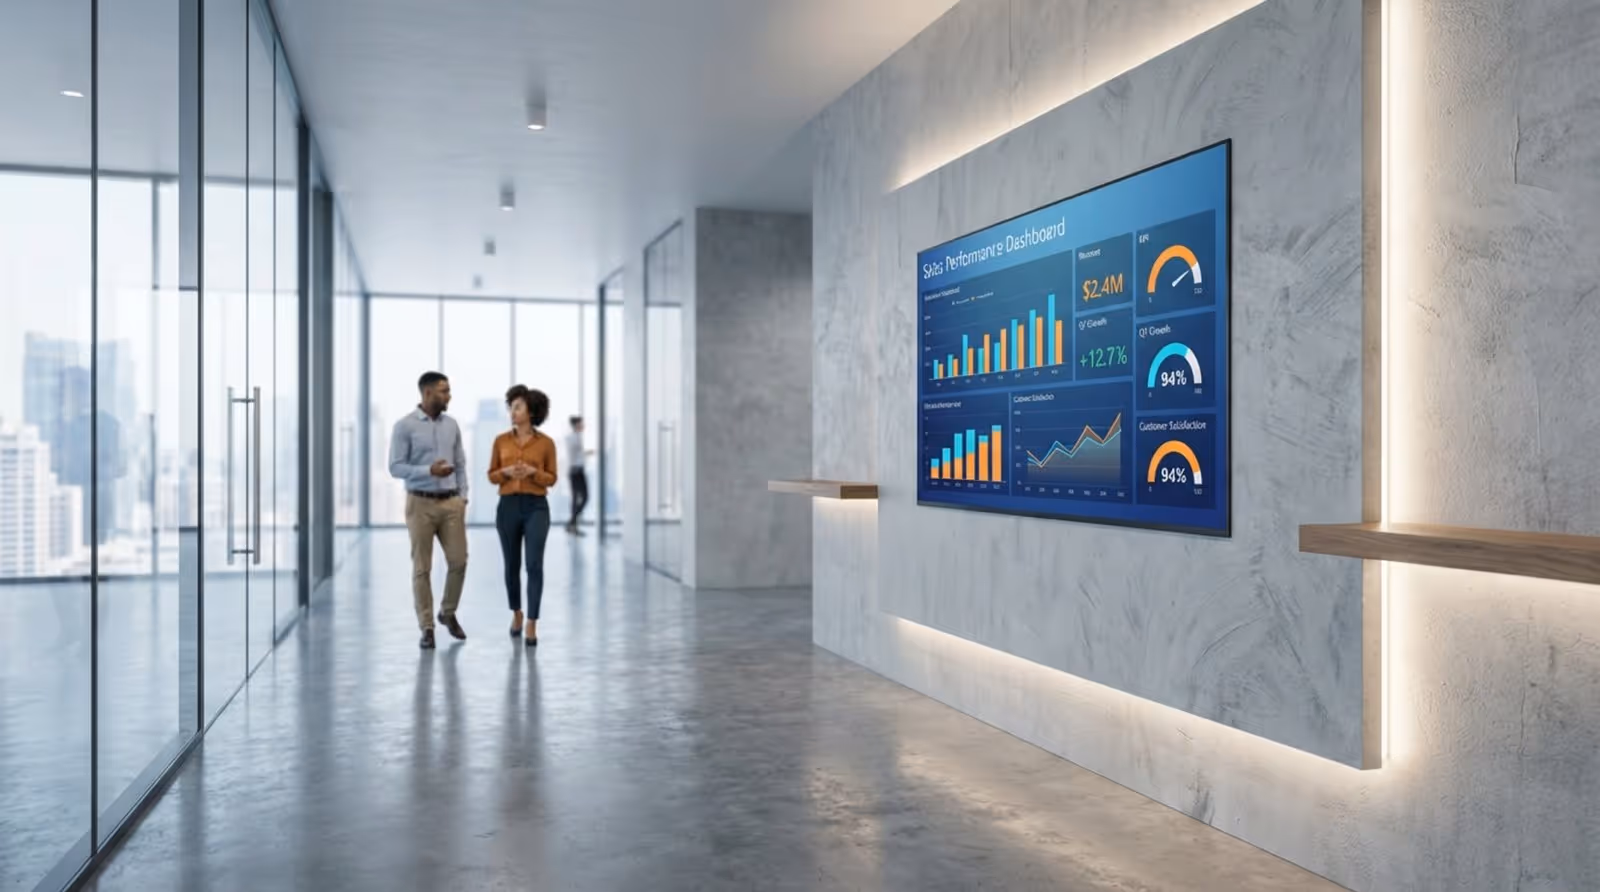
Visualizing data on shared screens increases transparency. Power BI is powerful in a meeting, but its impact multiplies when the data is visible all day. Displaying real-time KPIs in shared spaces keeps teams focused on the same goals and allows for faster reactions to performance changes.
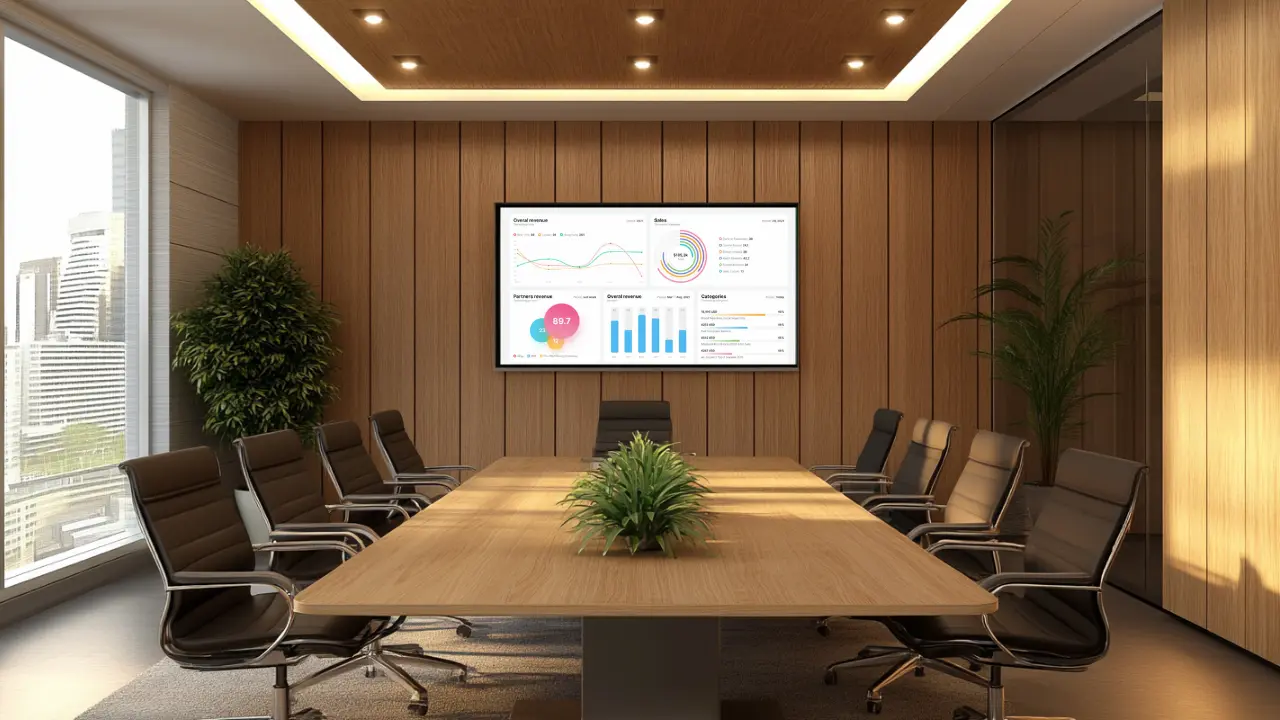
For managers, using digital signage in conference rooms ensures discussions are based on current facts, not outdated slide decks. It also adds context to meetings; if a question arises about a specific metric, the live dashboard is right there on the wall, ready to provide the answer.
Driving Data-Driven Culture in Organizations
Connecting Power BI with Look DS integrates insights into the daily workflow. When charts appear on screens in breakrooms or hallways, data becomes part of the office environment. This supports a culture where decisions are backed by evidence rather than guesswork.
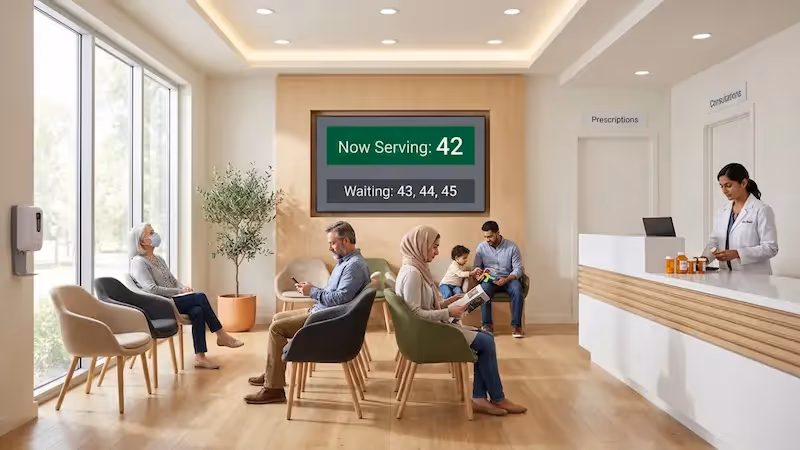
This is particularly effective in operational environments. In manufacturing, live production numbers can highlight bottlenecks instantly. In healthcare, waiting room screens can track service efficiency. When data is easy to see, it transforms from a hidden report into a practical tool for the whole team.

What Is Look DS and How Does It Relate to Power BI?
Key Features of Look DS
Look Digital Signage is a cloud-based platform built for businesses that need to manage screens without IT headaches. It scales smoothly from a single screen to thousands of locations. The Look CMS dashboard is intuitive, allowing you to organize content, manage user permissions, and monitor screen health from anywhere.
Look DS supports both simple full-screen content and complex screen layouts. You can split a screen to show a Power BI dashboard in one zone while running company news or weather updates in another. Whether you use the Look HDMI Player or the Look App on your existing hardware, the platform ensures reliable playback and secure management.
Integration Capabilities with Power BI
Look DS simplifies the connection to Power BI through its Look Apps marketplace. Instead of relying on unstable workarounds like public URLs or screen scrapers, Look DS provides a dedicated Power BI app. This integration allows you to authenticate securely with your Microsoft credentials directly within the CMS.
This approach respects your data security while providing flexibility. You can set refresh intervals to keep data current-down to every few seconds for critical operations-and even enable interactivity on touch-enabled displays, allowing users to scroll and filter reports directly on the screen.
Step-by-Step Process to Show Power BI Dashboards on Look DS
1. Prepare Your Power BI Dashboard
Start by preparing your report in the Power BI Service. Ensure your visuals are clean and your data sources are updating correctly. To use the integration, your Microsoft account generally requires a Pro or Premium license to support embedding and sharing capabilities.
Check your permissions. The account connecting to Look DS must have access to the workspace and the specific report. We recommend using a dedicated "service account" (a generic user account) with Member or Contributor access to the relevant workspace. This prevents display issues if a specific employee leaves the company.
2. Generate the Embed Link in Power BI
Ensure your report is published to a standard workspace in the Power BI Service. While you do not need to manually copy complex embed codes, the report must be accessible via the API. Save your report with the default filters and slicers you want to appear on the signage screens.
By saving the "default view" correctly in Power BI, you ensure that when Look DS loads the report, it displays exactly the data you intend, without requiring manual adjustment on the screen itself.
3. Access and Configure Look DS Platform
Log in to your Look CMS account and navigate to the Apps section. Locate the Power BI app and add it to your content. Inside the app settings, click to connect your Microsoft account. You will be redirected to Microsoft’s secure login page to enter your credentials.
Once authenticated, you will be returned to Look DS. The system now has a secure token to fetch your reports, meaning Look DS does not store your actual Microsoft password, keeping your security protocols intact.
4. Add Power BI Link to Look DS Content
With the account connected, select the Workspace and the specific Report or Dashboard you wish to display. You can choose to show a specific page or cycle through all pages in a report.
Adjust the Refresh Interval based on your needs. For high-paced environments like logistics centers, a short interval ensures accuracy. For general office dashboards, a longer interval may suffice. If you are using a touch screen, toggle the "Interactivity" option to allow users to manipulate the chart. Click Add Content to save this to your library.
Pro Tip: For the most dynamic and up-to-the-minute data display, set the refresh interval to as low as 1 second. Your digital signage will always reflect the latest information from your dashboards.
5. Assign Dashboards to Digital Signage Screens
Now, add your Power BI content to a Playlist. You can schedule this playlist to run 24/7 or only during business hours using Smart Scheduling. If you want to display the dashboard alongside other info, use the Screen Layouts feature to assign it to a specific zone on the screen.
Finally, select the screens you want to update and click "Publish." Your Look Players will download the configuration and begin displaying the live dashboard. You can use the preview feature in the CMS to verify how it looks before walking over to the screen.
Best Practices for Optimizing Power BI Visuals on Digital Signage
Adapting Dashboard Layout for Screen Size
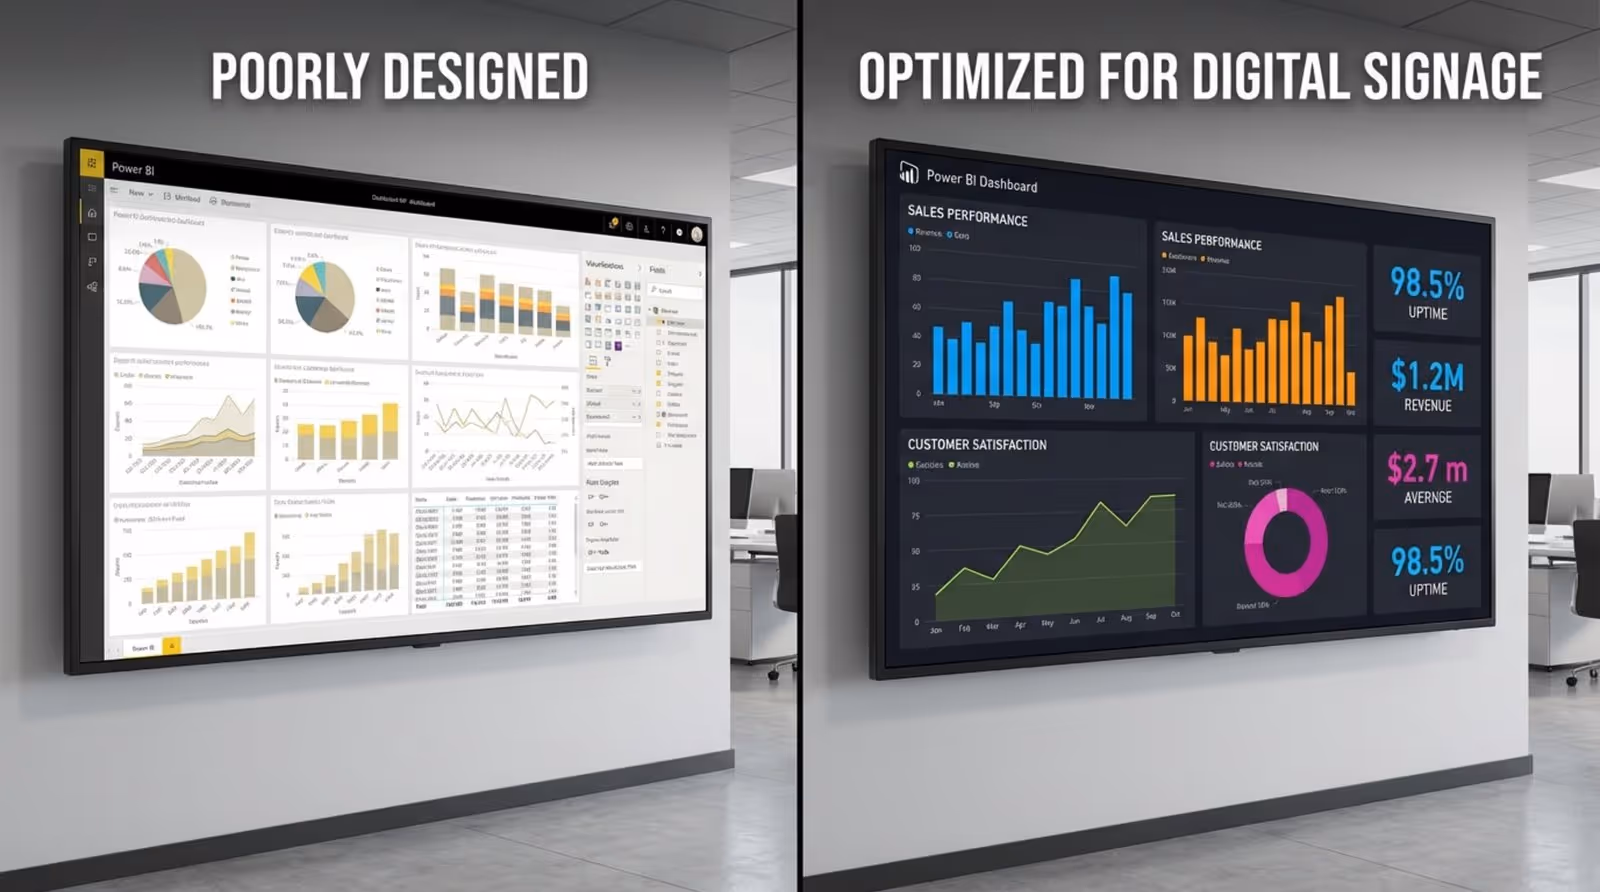
Digital signage screens are viewed from a distance, unlike laptop monitors. Design your Power BI reports with this in mind. Use larger font sizes (at least 24pt for key metrics) and high-contrast colors. Dark modes often work well on large displays to reduce glare and eye strain.
Keep it simple. A dashboard with 20 small charts will be unreadable from six feet away. Focus on 3-4 distinct KPIs that tell the story instantly. Remove unnecessary navigation bars or slicers that clutter the view, unless the screen is interactive.
Ensuring Data Security and Privacy
Data on a wall is data that anyone can see. Be mindful of where you place screens displaying internal metrics. Use User Roles in Look DS to restrict who can change the content sources. This prevents unauthorized users from accidentally displaying sensitive financial data on a reception screen intended for visitors.
Segment your content strategy. Public-facing screens in lobbies should show general company news or welcome messages. Reserve detailed Power BI performance dashboards for employee-only areas or secure office zones. Look DS allows you to manage these distinct groups of screens from a single dashboard.
Automating Updates and Refresh Schedules
Leverage automation to reduce manual work. Once your Power BI integration is active, Look DS handles the display logic. However, you must ensure your data source in Power BI (e.g., the SQL database or Excel file) is refreshing automatically within the Microsoft environment.
Understanding refresh settings:
Align these two settings. There is no benefit to refreshing the screen every minute if the Power BI data only updates once a day.
Customizing Dashboards for Different Audiences
Relevance drives engagement. Use Playlists to target specific teams. Your sales floor needs revenue charts, while your support team needs ticket volume metrics. Create specific reports for each department and assign them to the corresponding screens.
You can also use Look DS to add context. If a metric requires explanation, use the Content Creator or a split-screen layout to add a text note next to the dashboard. This helps viewers understand why a number is trending up or down without needing to ask a manager.
How to Troubleshoot Common Issues with Power BI on Look DS
Connectivity and Authentication Errors
If your dashboard stops updating, the most common cause is an expired authentication token or a changed Microsoft password. To resolve this, go to the Apps section in Look CMS and re-authenticate your Power BI account. This refreshes the secure connection.
Network firewalls can also block the connection. Ensure your media players are on a network that allows traffic to Microsoft’s servers. If you see a login prompt on the screen itself, it usually indicates the player cannot reach the authentication server automatically.
Display or Formatting Problems
If a report looks blurry or cut off, check the resolution settings on your Look HDMI Player or device. Ensure the output resolution matches the TV (usually 1920x1080 or 4K). Mismatched aspect ratios can cause black bars or stretching.
Performance issues, such as stuttering, often result from overly complex reports running on basic hardware. If your dashboard has heavy animations or high-density visuals, simplify the design or upgrade to a more powerful player. You can verify performance using the preview tools in Look CMS.
Data Refresh and Update Delays
If the screen shows old data, first verify that the dataset has updated in the Power BI Service. If the data is old at the source, Look DS cannot display new numbers. Power BI Pro licenses have limits on daily refreshes (usually 8 per day), so plan your schedule accordingly.
If the source is fresh but the screen is stale, check the internet connection of the player using the Monitoring tools in Look CMS. An offline player will continue to play cached content (thanks to Offline Playback features), but it cannot fetch new live data until connectivity is restored.
Frequently Asked Questions about Power BI Dashboards on Digital Signage
Is It Secure to Display Power BI Data on Public Screens?
Yes, provided you manage it correctly. Look DS uses secure token-based authentication (OAuth 2.0), so your credentials are not exposed. By controlling physical access to the screens and using the CMS to restrict content to specific devices, you maintain a high level of security.
For added safety, restrict the editing permissions within Look DS so that only authorized data managers can alter the Power BI widgets.
Can I Show Multiple Power BI Reports in Rotation?
Absolutely. You can add multiple Power BI items to a single playlist. This prevents screen burn-in and keeps viewers engaged. We recommend setting a duration of at least 60 seconds per dashboard to allow viewers enough time to digest the information.
What Devices Are Compatible with Look DS and Power BI?
Look DS is hardware-agnostic. For the best experience with data-heavy dashboards, we recommend robust hardware like the Look HDMI Player.
Key Takeaways for Displaying Power BI Dashboards on Digital Signage with Look DS
Connecting Power BI to your digital signage is a practical step toward a more transparent, data-driven workplace. By using Look Digital Signage, you remove the technical barriers to entry-no complex coding or IT overhaul is needed. You simply connect your account, select your reports, and publish.
Remember that Look DS is designed to support you as you scale. Whether you are testing one screen or rolling out a network across multiple offices, features like remote management, monitoring, and smart scheduling keep your screens running smoothly. If you are ready to see how your data looks on the big screen, you can start a free trial today and build your first playlist in minutes.