Table of Content
How do you know if your team is actually reading the breakroom screens? Measuring engagement isn't just about counting heads; it’s about tracking how well your internal messages drive real action. By monitoring interactions like QR code scans or poll responses, you can turn passive displays into active communication channels that keep your workforce informed and connected.
What Is Breakroom Digital Signage Engagement?
Influencing Employee Behavior Without the Pressure
In a breakroom, digital signage acts as a gentle nudge rather than a loud command. Unlike the shop floor or a desk, where pressure is high, the breakroom is where staff relax. This makes it the ideal spot to shape habits without being pushy. A screen can remind people to follow safety protocols or sign up for benefits in a way that feels helpful, not demanding.
These displays also act as icebreakers. When a screen highlights an "Employee of the Month" or a recent team win, it gives colleagues something positive to talk about over coffee. By placing screens near high-traffic spots like microwaves or fridges, you blend company messaging into the natural flow of the break, turning downtime into a moment for connection.
Why You Can’t Afford to Ignore Engagement
Engagement is the difference between communication and noise. For deskless workers in warehouses, healthcare, or retail, a breakroom screen might be their only link to company news. If they tune out, a massive communication gap opens up. Tracking engagement ensures your messages actually land.

Data also turns guesswork into strategy. When you can prove to leadership that a safety campaign on digital signage reduced accidents or increased policy sign-ups, you validate the investment. High engagement usually signals a healthy culture where employees feel seen and aligned with business goals.
Why Track Engagement with Breakroom Digital Signage?
Building a Stronger Workplace Culture
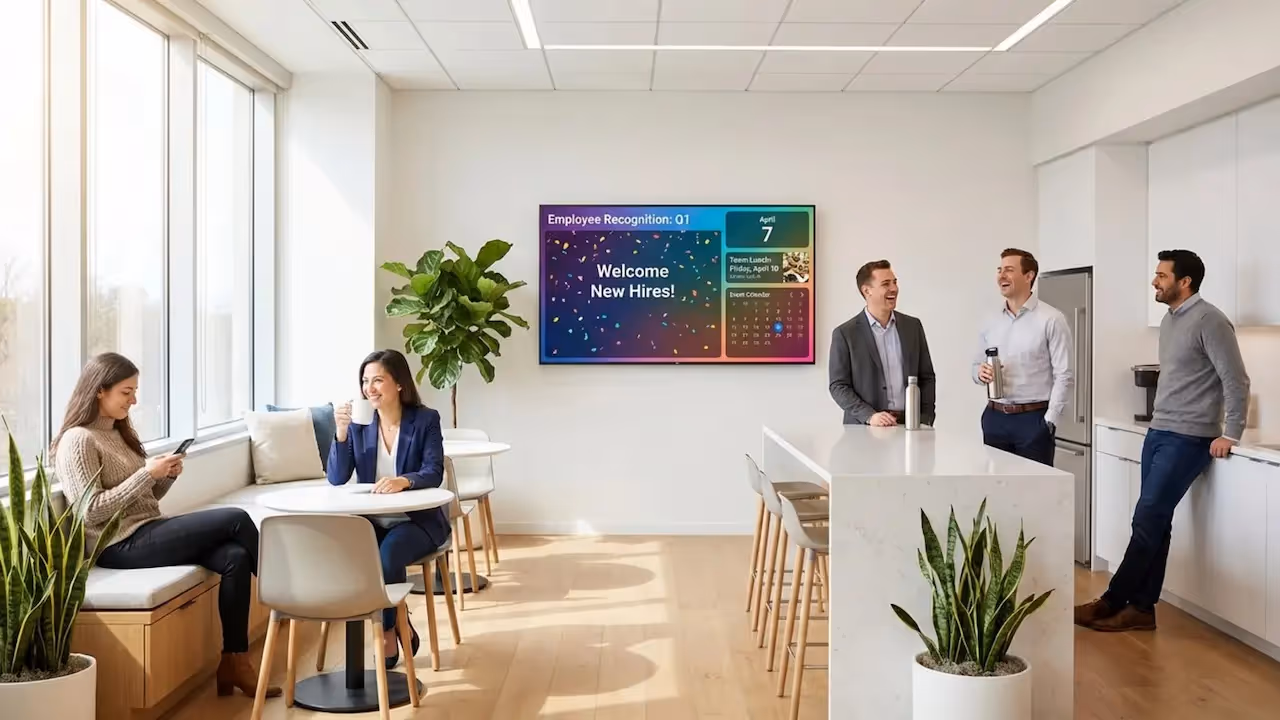
Tracking engagement helps you see the people behind the numbers. When staff interact with posts about work anniversaries or charity drives, you are witnessing culture in action. Visible recognition on screens can boost morale and productivity because people naturally work better when their efforts are acknowledged.
Consistently sharing leadership updates and milestones also builds trust. It keeps everyone-from the front line to the back office-on the same page. This transparency turns the breakroom into a space that reinforces values and keeps the team unified.
The Risks of Flying Blind
Without data, you risk "message fatigue." This happens when staff stop looking at screens because the content feels stale or irrelevant. If you keep posting dry memos while your team ignores them, you are wasting time. Tracking engagement reveals these dead spots so you can fix them fast.
You might also miss location-specific issues. If one branch has low interaction rates, the screen might be poorly placed, or the content might not resonate with that specific team. Identifying these gaps allows you to adjust quickly, ensuring critical updates, like emergency procedures, are actually seen when it matters most.
Which Metrics Reveal True Engagement?
Quantitative Metrics: The Hard Numbers
To measure success, you need concrete data. The most effective method is using Calls to Action (CTAs). By adding a QR code or a short URL to your slide, you can track exactly how many people took the next step. If 50 people scan a code for a staff survey out of 200 employees, you have a clear engagement baseline.

Look Digital Signage makes this easy with Playback Analytics. You can verify how often specific content played and compare that frequency against the actions taken. If a slide played 100 times but got zero scans, it’s time to rethink the design or the offer.
Qualitative Feedback: The Context
Numbers tell you "what," but feedback tells you "why." Simple observation goes a long way. Spend a few minutes in the breakroom and watch. Do people stop and look, or do they walk right past? Do they chuckle at a fun slide?
You can also use the screens to ask for feedback directly. A quick survey asking, "Is this information helpful?" can provide huge insights. Keep it short to encourage responses. This not only gives you data but makes employees feel heard, which increases their interest in the screens.
Tools and Technologies to Measure Effectiveness
Using What You Have: QR Codes and Interactions
You don't need expensive sensors to start measuring. QR codes are simple, free, and highly effective. You can generate them directly within the Content Creator in Look CMS and drop them onto any slide. Whether it links to a training video, a discount voucher, or a suggestion box, a scan is undeniable proof of engagement.

For more advanced setups, interactive scenarios allow staff to touch the screen to view bus schedules, canteen menus, or safety maps. This transforms the screen from a TV into a self-service kiosk.
Smart Integration and Analytics
The best results come when your signage talks to your other systems. Look Digital Signage offers integrations (via API or Zapier) that allow you to display data from internal dashboards or tools. If you show a live "Sales Thermometer" or "Days Without Injury" counter, you can track if these dynamic visuals get more attention than static images.
Additionally, using a platform like Look CMS allows you to manage screens remotely from anywhere. You can pull reports on uptime and proof-of-play to ensure your carefully planned content is actually running as scheduled.
How to Interpret Engagement Results
Spotting Patterns with Scheduling
Data often reveals timing trends. You might find that engagement peaks during the morning coffee rush but drops off by late afternoon. Use this insight to apply Smart Scheduling. Schedule critical announcements for high-traffic times and switch to lighter, entertainment-focused content during slower periods.
Compare content types as well. If employee shout-outs consistently outperform operational updates, try blending the two. Use a personal story to lead into a policy reminder. This keeps the content "human" while still delivering key information.
Setting Realistic Goals
Don't expect 100% engagement immediately. Start with a benchmark-run a campaign for 90 days and see what your average scan rate is. Then, set a specific goal, such as "increase survey responses by 15% next quarter." Clear targets help you prove the value of the system to your management team.
Connecting Data to Communication Strategy
Aligning Content with Business Goals
Your breakroom screens should support the company's main objectives. If the goal is sustainability, use your screens to show real-time energy savings or recycling tips. When you link screen content to business KPIs and then use analytics to show that staff are reading it, you prove the system's ROI.
Targeting Specific Groups
Blanket messaging rarely works. Warehouse teams need different info than the sales department. Look Digital Signage allows you to organize screens into groups and manage them via a single dashboard. You can send safety alerts to the factory floor while sending sales leaderboards to the office breakroom, ensuring relevance for everyone.
Best Practices for Increasing Engagement
Mix Up Your Content
To keep eyes on the screen, variety is key. A good playlist mixes:
- Recognition: Birthdays, work anniversaries, and "kudos."
- Utility: Weather, traffic, and cafeteria menus.
- Company News: distinct, short updates.
- Fun: Trivia or "photo of the week."
Using Ready-made Templates in Look CMS helps you create professional-looking variations of these slides in minutes, keeping the playlist fresh without needing a designer.

Placement Matters
Even the best content fails if the screen is hidden. Place displays at eye level in high-dwell areas-near the coffee machine, the fridge, or the main seating area. Avoid placing screens high up in corners where they look like background noise. If you have existing TVs in these spots, the Look App or a plug-and-play Look HDMI Player can turn them into managed signage instantly.
Common Questions About Breakroom Signage Engagement
What is a good engagement rate?
For active engagement like QR scans, a rate of 10% is often a solid baseline. Passive engagement (viewing) should be much higher. Focus on trends rather than a single number-if the rate is climbing, your strategy is working.
How often should I review the data?
Check your Playback Analytics and interaction data at least once a quarter. This gives you enough time to spot trends without reacting too quickly to a single bad week.
Key Takeaways
Breakroom digital signage is more than just a digital bulletin board; it’s a powerful tool for connecting with employees in a low-stress environment. By using clear metrics, simple interactive tools like QR codes, and smart scheduling, you can turn passive viewing into active participation.
To get started, focus on reliability and ease of use. Look Digital Signage provides the tools you need-from Smart Scheduling to Playback Analytics-to prove ROI and keep your internal communications running smoothly. Start a free trial today to publish your first playlist and see how simple it is to engage your team.