Table of Content
How do you verify that your digital displays are driving revenue rather than just consuming power? Successfully measuring ROI requires tracking a mix of hard data-like sales uplift and dwell time-and operational efficiencies like staff time saved. By monitoring foot traffic to gauge reach, engagement rates (like QR code scans) to measure interest, and conversion metrics to prove value, you can transform your screens from simple decorations into a data-driven communication engine.
For mall operators and retailers, understanding the payback from digital signage is what separates a static monitor from a sales driver. This guide breaks down the essential metrics, calculation methods, and strategies you need to measure and prove the real value of your digital signage network.
Mall Digital Signage ROI: What Matters Most
What Is ROI for Mall Digital Signage?
Digital signage ROI is the return on investment from your screen network. It goes beyond comparing software costs against ad revenue. It covers both direct financial gains and operational improvements, weighed against your total cost of ownership.
For malls, direct gains usually come from increased tenant sales or third-party advertising revenue. Indirect gains are just as vital: better brand awareness, reduced printing costs, and a smoother visitor experience. By analyzing both sides, you can see how effective the investment is and ensure every playlist item supports a clear business goal.
Why Track ROI in Mall Environments?
Malls are busy environments where every square foot and second of attention counts. Without data, you risk running "set and forget" screens that don't deliver results. Tracking ROI helps operations teams justify the setup costs of hardware and software to stakeholders.
Tracking performance also provides the insights needed to optimize your content. When you know which layouts work and which zones are ignored, you can adjust your strategy in minutes. This data-informed approach keeps your network aligned with goals like driving footfall to quiet wings or supporting tenant promotions.
Common Challenges When Measuring ROI in Malls
One common hurdle is valuing "soft" benefits like customer satisfaction. A sales increase is easy to spot in a spreadsheet, but it is harder to price the frustration saved when a digital directory helps a shopper find their way quickly. Additionally, shifting market trends can make year-over-year comparisons difficult.
Data silos also pose a challenge. Many teams struggle to link signage metrics with POS (point-of-sale) data. To solve this, operators need clear goals and modern tools, like Look Digital Signage-that simplify management and help connect screen performance with real-world outcomes.

Defining Objectives for Mall Digital Signage
Setting Measurable Goals: Sales, Engagement, or Brand Awareness?
Every effective signage program starts with specific goals. A mall looking to revitalize a quiet corridor might aim to lift sales by displaying directional promos. Another might focus on engagement, targeting 500 QR code scans for a loyalty app within a month.
Setting these targets early prevents screens from becoming digital posters. If your goal is brand awareness, focus on impressions. If it is sales, track transaction counts. If it is safety, track how quickly you can deploy emergency alerts from anywhere.

Aligning Signage Goals with Mall Business Outcomes
Digital signage should support the mall’s broader strategy. If your focus is improving the "omnichannel" experience, screens can bridge the gap by showing social media feeds or click-and-collect information.
Involving marketing, operations, and IT teams ensures the signage program supports the whole facility. When screen content aligns with email campaigns and in-store promotions, you create a consistent message that reinforces your brand.
Key Metrics to Track for Mall Digital Signage ROI
Foot Traffic and Dwell Time
First, you need to know if people are seeing your screens. Foot traffic indicates potential reach, while dwell time measures how long they stop to look. In high-traffic walkways, digital signage can capture significant attention, making these numbers your baseline for calculating impressions.
High traffic with low dwell time suggests your location is good, but the content may not be engaging. High dwell time indicates your message is working. Analytics tools can help you visualize where people stop and look.
Engagement Rate: Impressions, Interactions, and Attention Time
Engagement measures active participation, such as touching a kiosk screen, scanning a QR code, or following a call-to-action. Interactive scenarios can significantly lift engagement compared to static images.
Attention time helps you judge content quality. It tracks how long a viewer focuses on the message. Monitoring these metrics allows you to identify which templates or videos pull viewers in most effectively.
Conversion Metrics: Sales Uplift and Lead Generation
For many managers, conversion is the priority. This metric tracks what shoppers do after seeing a display-such as a sales spike for a featured product or increased coupon usage. By comparing playback reports from Look DS with sales data, you can see which playlists drive revenue.
Lead generation is another valuable metric. This includes newsletter sign-ups via QR codes or loyalty program registrations at a kiosk. These leads offer long-term value for future marketing efforts.

Operational Metrics: Cost Savings and Efficiency Gains
ROI isn't just about income; it is also about savings. Digital screens can reduce printing and distribution costs by eliminating paper posters. Remote management saves staff hours, as teams can update thousands of screens in minutes without walking the floor.
Efficiency gains extend to customer service. Digital wayfinding can reduce questions at information desks, freeing staff for other tasks. Reliable uptime-ensured by features like offline playback-keeps the shopper experience smooth without constant IT intervention.

Brand Recall and Customer Experience Impact
Digital signage influences how visitors perceive your mall. High-quality visuals aid brand recall, while helpful content like weather updates or directories reduces perceived wait times in queues.
You can measure these impacts through surveys. Ask shoppers if digital directories improved their visit or if they recall specific ads. This qualitative feedback complements your hard data.
Methods and Tools for Measuring Mall Digital Signage ROI
Quantitative vs Qualitative Data Collection
A complete ROI analysis uses both numbers and feedback. Quantitative data (sales figures, dwell times) tells you "what" happened. This data is often readily available through your analytics dashboards.
Qualitative data explains "why." Surveys and interviews reveal what shoppers liked or found confusing. This context helps you determine if your content builds loyalty or just delivers a temporary boost.
Technologies for Footfall and Engagement Tracking
Modern setups use various tools to track performance. Cameras and sensors can estimate impressions, while Wi-Fi analytics can track movement through zones. These insights help you understand which screen layouts grab attention.
Using anonymous audience measurement helps you tailor content. If data shows a younger demographic in the evenings, you can schedule relevant content automatically using smart scheduling tools.

Data Integration: POS, Wi-Fi Analytics, and Customer Surveys
To see the full picture, connect your signage data with other systems. Comparing CMS playback logs with tenant POS reports reveals if a specific ad slot correlated with sales. Wi-Fi analytics can show if screen viewers later visited specific stores.
You can also gather feedback directly on-screen using interactive forms or QR codes. Centralizing this data helps leaders make informed decisions about the network.
A/B Testing and Campaign Benchmarking
A/B testing allows you to refine content without guessing. Show two versions of a promotion, with different headlines or images on different screens, and compare the results. Continuous testing leads to better engagement over time.
Benchmarking is also critical. Compare current performance against past campaigns. Regular reviews help keep the program efficient, even as shopping habits change.
Step-by-Step ROI Calculation for Mall Digital Signage
Understanding the ROI Formula
The standard ROI calculation is:
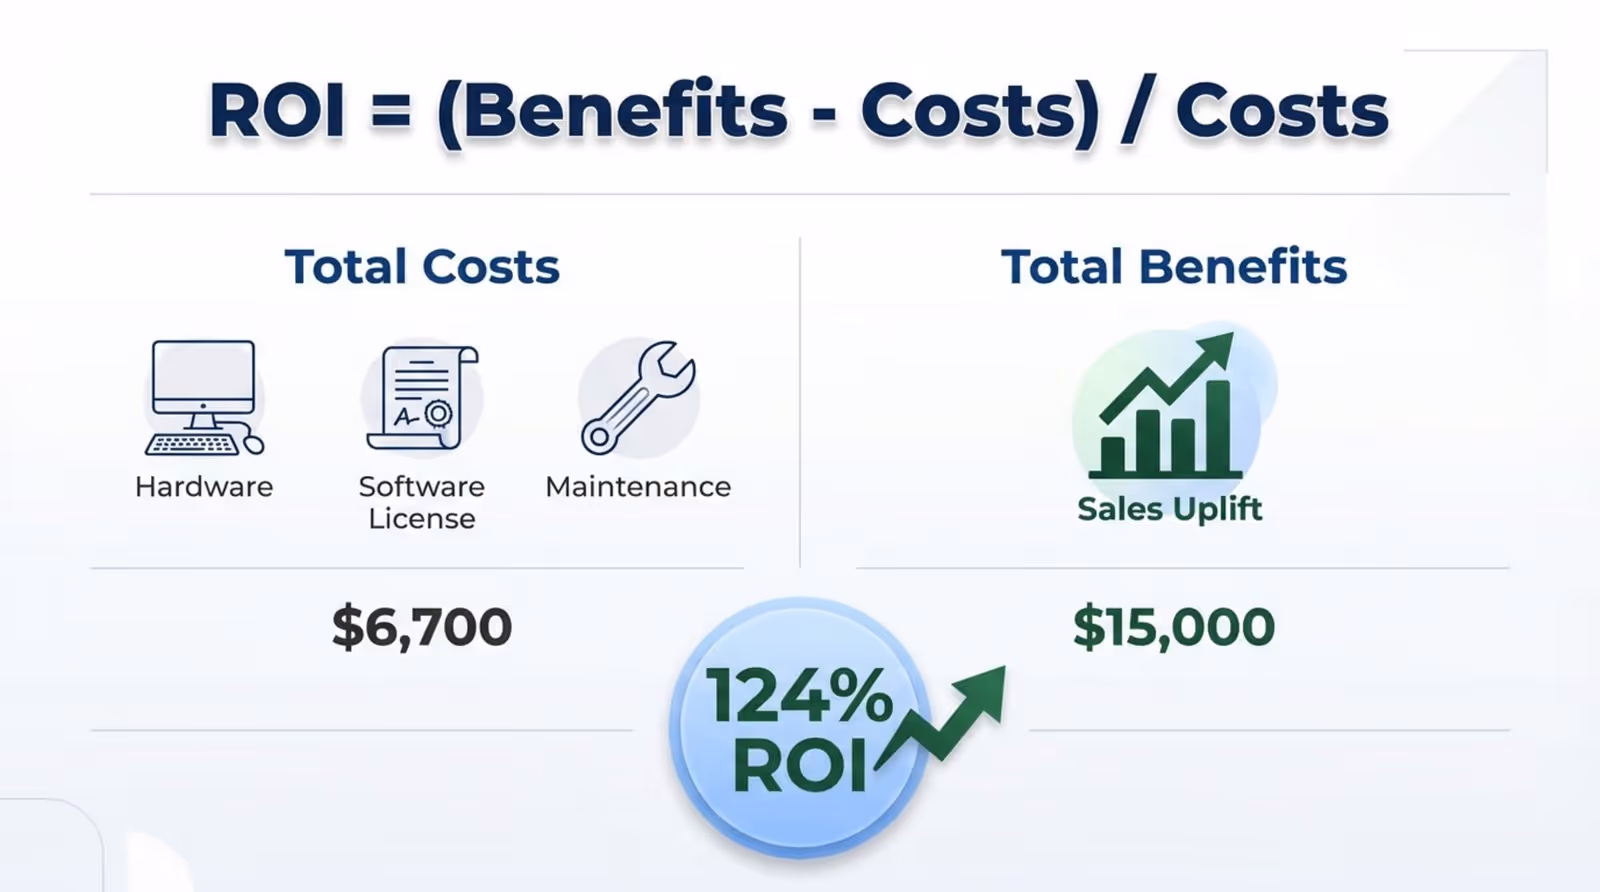
ROI = (Total Benefits − Total Costs) / Total Costs × 100
This percentage shows profitability. For malls, "Total Benefits" includes direct revenue plus estimated operational savings (like reduced printing).
While ROI focuses on finance, ROO (Return on Objectives) tracks goal achievement. A campaign might not spike sales immediately, but could successfully reduce wayfinding complaints, delivering strong value.
Breaking Down Investment: Hardware, Software, and Content Costs
To calculate costs accurately, include:
- Hardware: Screens, mounts, and media players (like the Look HDMI Player).
- Software: Subscription fees for your CMS.
- Content: Creation costs, or savings if using built-in tools like the Look AI Wizard.
- Maintenance: Power and occasional upkeep.
Calculating Financial and Intangible Benefits
On the benefits side, list direct revenue from ads and sales uplift. Then, factor in savings. If digital updates save your team 5 hours a week compared to swapping paper posters, that labor saving counts toward ROI.
For intangible benefits like brand awareness, look for correlations in web traffic or social media mentions during campaigns. These indicators help quantify the broader impact of your screens.
Sample ROI Calculation for a Mall Signage Campaign
Here is a simplified example for a retail deployment:
In this scenario, the system pays for itself and generates profit in the first year, demonstrating the potential of a well-managed network.
Common Pitfalls and Best Practices for Mall Signage ROI
Mistakes to Avoid When Tracking ROI
A frequent mistake is treating screens as "set and forget." Old content fades into the background. Using tools like Look Digital Signage helps you keep playlists fresh with templates and smart scheduling.
Another error is tracking the wrong metric. If your goal is sales, tracking only impressions won't prove value. Ensure you are measuring outcomes that matter to your stakeholders.
Best Practices for Accurate and Actionable Measurement
Establish a regular review schedule to analyze your data. Use analytics dashboards to visualize trends and share these findings with tenants and management.
Leverage dynamic content for better results. For example, use weather-triggered ads to promote umbrellas when it rains. Contextual relevance often drives higher conversion rates.
Real-World Case Studies: Mall Digital Signage ROI in Action
Boosting Retail Sales Through Targeted Campaigns
Leading brands use digital signage to drive specific outcomes. For instance, fast-food chains utilize self-service kiosks to improve order accuracy and speed, often increasing average ticket size. Retailers frequently use digital screens in pop-up locations to create visual interest that draws shoppers in.
Retailers like Leroy Merlin have successfully used cloud-based content platforms to reduce campaign rollout times significantly. By simplifying the publishing process, teams can focus on strategy rather than technical setup, proving that ROI often comes from internal process improvements.
Enhancing Shopper Experience and Brand Awareness
Beauty retailers often use signage to bridge the online-offline gap, displaying social media feeds and tutorials to build shopper confidence. Automotive brands utilize interactive displays in showrooms to let customers explore configurations, deepening engagement.
Home goods retailers have also utilized screens to grow their social media presence by prompting shoppers to follow them via on-screen calls to action. This demonstrates that clear, actionable content can expand brand reach well beyond the physical store.

Improving ROI Over Time: Continual Optimization Strategies
Interpreting Tracking Results and Adjusting Content
Building ROI is an ongoing process. If analytics show low dwell times, your content may need to be shorter or more visually striking. Look Digital Signage allows you to test different layouts and update them instantly based on performance.
Regularly refreshing content prevents "banner blindness." Use scheduling features to ensure return visitors see something new, keeping your messaging effective.
Why Look Digital Signage is a Strong Fit for Malls
For mall operators looking to maximize ROI without complex IT headaches, Look Digital Signage is an ideal solution. It is designed to help teams manage networks of any size reliably.
- Playback Analytics: Verify exactly what played and when, essential for proving value to advertisers and tenants.
- Smart Scheduling: Automate content based on time of day or day of the week to target specific shopper demographics.
- Proof-of-Play: detailed logs ensure compliance and transparency for third-party ads.
- Remote Management: Update screens across the entire property from a single dashboard, saving staff time and ensuring consistency.
Conclusion: The Future of Mall Measurement
The future of mall digital signage lies in data-driven decisions. By moving away from guesswork and using tools that offer real-time insights, mall operators can turn their screens into a responsive, profitable asset. Whether you are aiming to increase footfall, boost tenant sales, or simply streamline operations, the right platform makes it easy to track success and prove ROI.