Table of Content
How can manufacturing leaders turn raw factory data into immediate action on the production floor? The answer lies in visualizing metrics through manufacturing dashboards displayed on digital signage, giving teams the real-time visibility needed to spot bottlenecks and adjust workflows instantly. This guide explains how to use these visual tools to bridge the gap between static data and daily operations.
In modern manufacturing, data is only useful if it is seen quickly. A well-built dashboard acts as a guide, turning streams of numbers into a clear story. By putting everyone-from machine operators to executives-on the same page via centralized screens, dashboards turn data from a record of the past into a tool that drives what happens next.

What Are Manufacturing Dashboards and Why Do They Matter?
The Role of Dashboards in Manufacturing Operations
In many factories, data is scattered-maintenance logs in one system, production targets in another, and quality reports in a third. Manufacturing dashboards act as the "central nervous system," pulling these pieces into one clear view displayed on digital signage screens across the floor. They give a high-level picture of how the site is running while letting you zoom in on specific lines or shifts.

These tools work by opening up information to more people. When a supervisor sees live numbers for planned output versus actual production, they can adjust staffing or machine settings immediately. This visibility builds a culture of responsibility because everyone sees the numbers that define success. In a competitive market, seeing clearly is the first step to acting effectively.
Key Functions That Connect Data with Real-World Actions
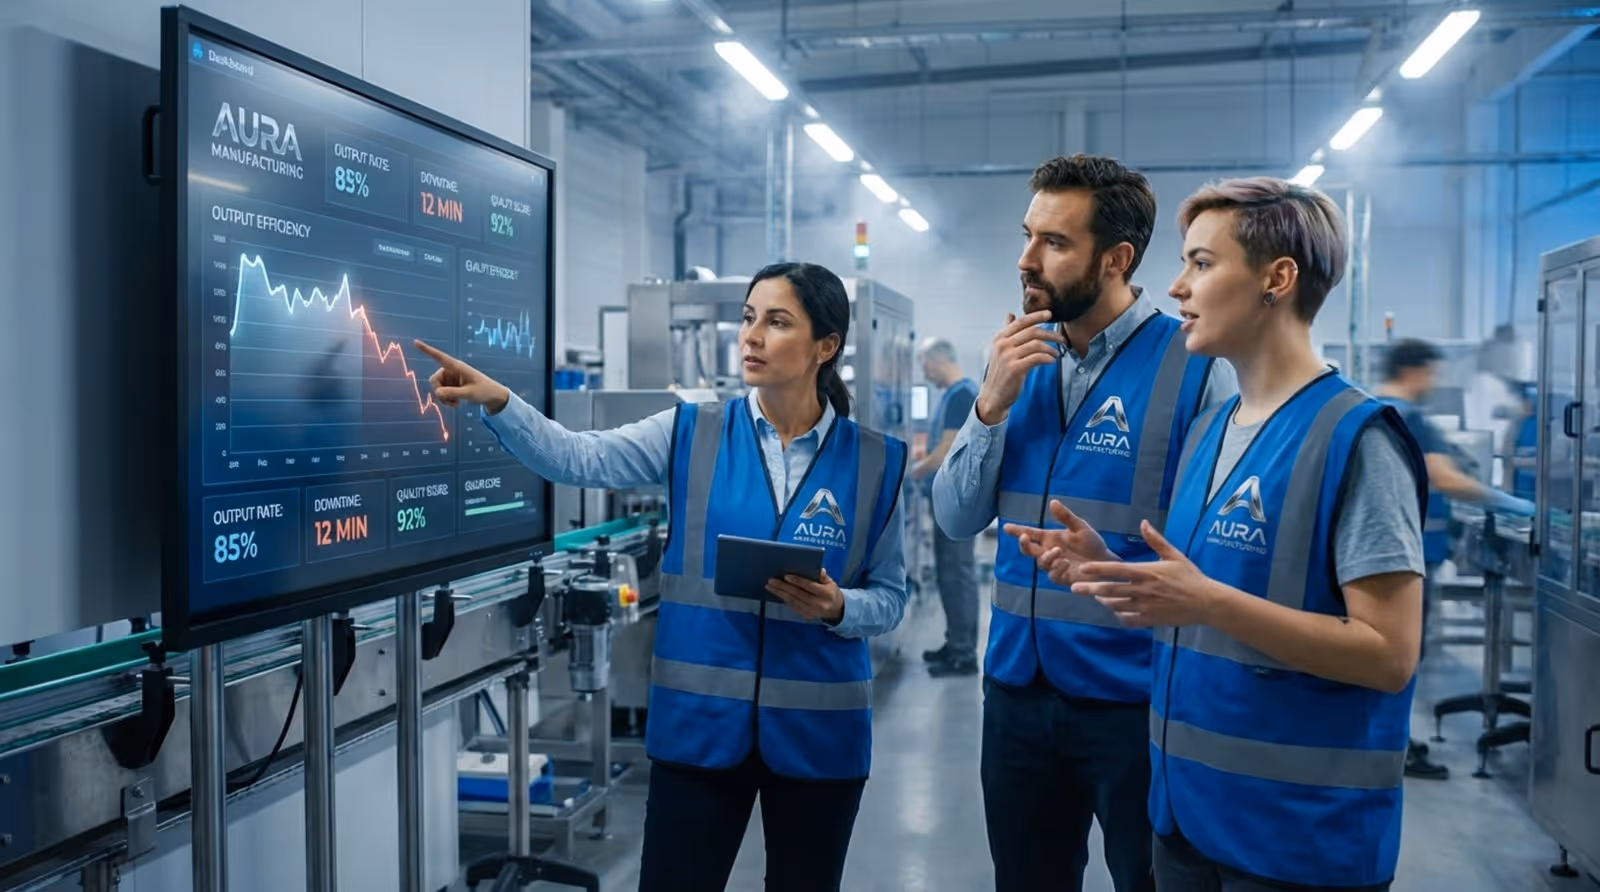
The main job of a manufacturing dashboard is to turn "what happened" into "what do we do now." It does this with visual tools like heat maps, gauges, and trend lines. For example, if a dashboard on the shop floor shows that cycle time on one line has climbed by 15%, it serves as an immediate warning to check for mechanical issues or process changes.
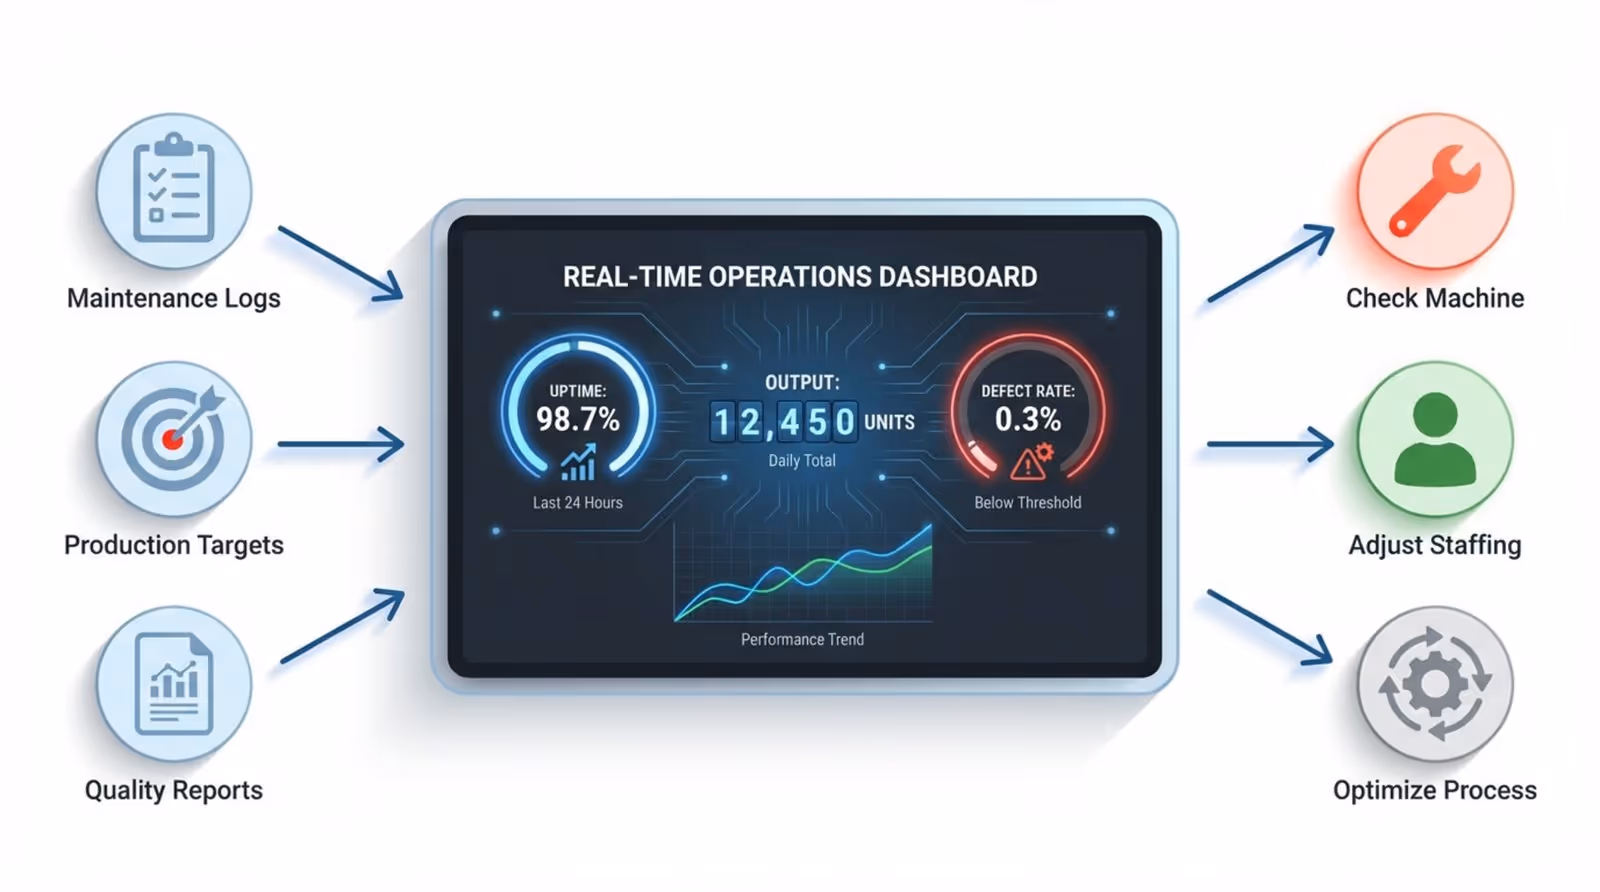
Dashboards also connect data to action by automating information flow. Instead of a technician manually filling out a report, the system can display an alert on a screen as soon as a sensor spots a problem. This cuts the time between a problem appearing and someone fixing it, helping you avoid expensive shutdowns.
Benefits of Bridging the Gap Between Data and Action
Real-Time Visualization Increases Operational Awareness
Operational awareness separates reactive plants from proactive ones. Real-time visualization lets managers see the "pulse" of the factory. With live data displayed on digital signage, teams see what is happening right now, rather than waiting for an end-of-shift report. This steady feedback means no one works blindly.

When everyone sees the same live data, it removes guesswork. If a screen shows a sudden spike in energy use, the facility manager can respond straight away. This awareness covers machines, material flow, and environmental conditions, giving you a full picture of the plant.
Faster Decisions Drive Productivity and Responsiveness
Speed is a key advantage. Manufacturing dashboards speed up decisions by removing the need for manual analysis. Instead of building reports, leaders can look at a screen and see exactly where work is slowing down.
This speed leads to higher productivity. When a machine stops, the dashboard can help route work to other equipment or signal for maintenance. By reducing the time between spotting a problem and fixing it, you can increase uptime and keep lines running smoothly.
Data-Driven Insights Improve Efficiency
Efficiency often comes from small improvements. By comparing historical data with live data, dashboards reveal patterns that are easy to miss. You might find that one raw material source leads to more defects, or that output drops when the temperature shifts. These findings help you make targeted improvements.
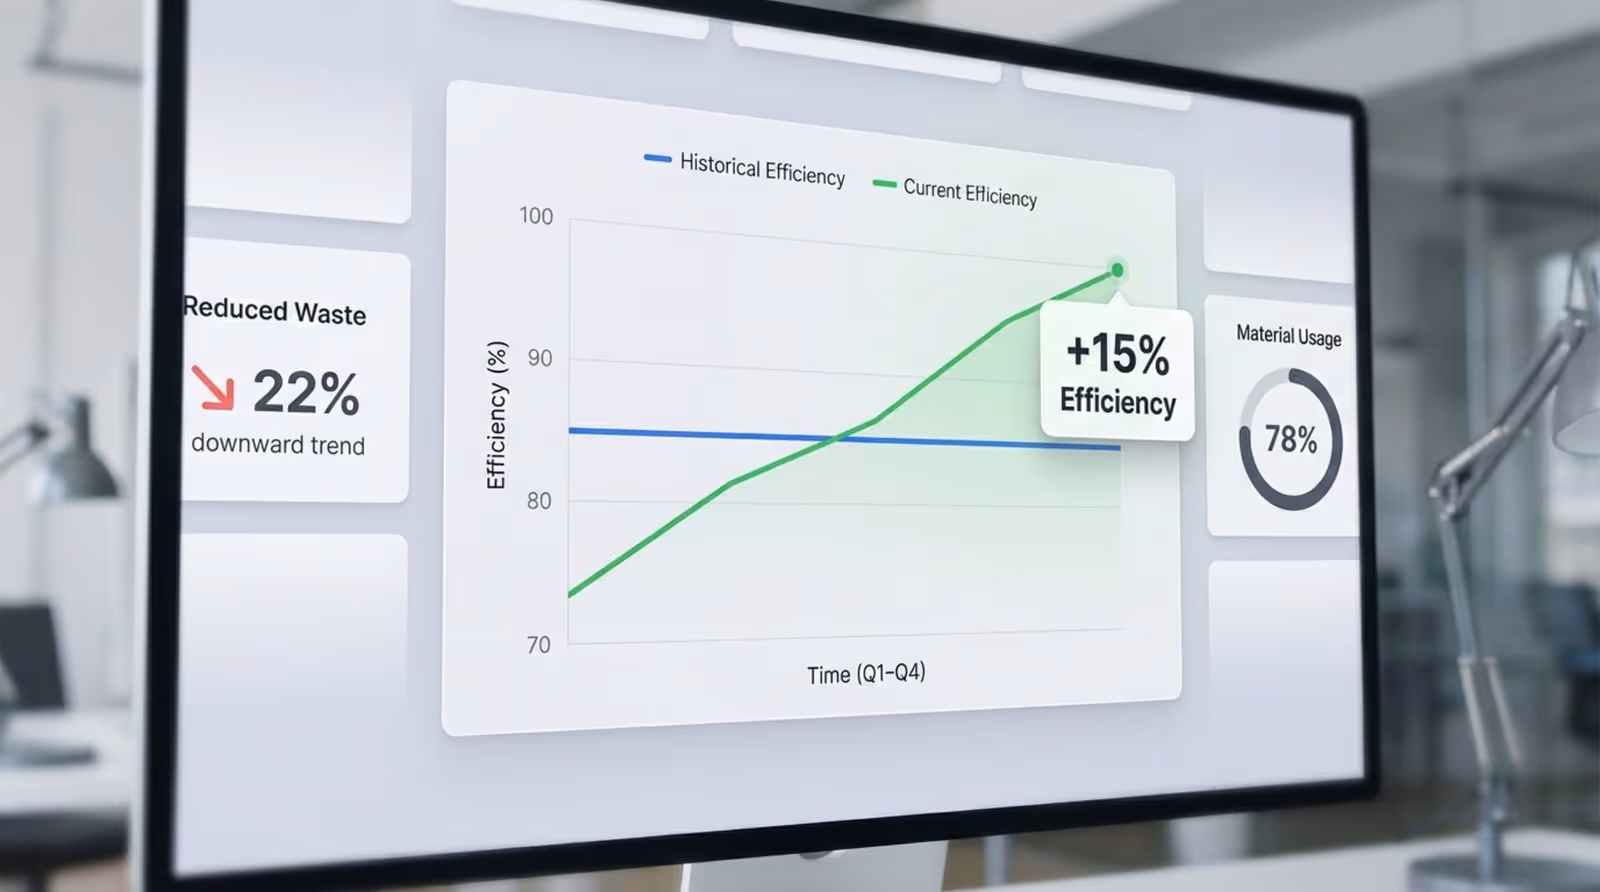
Dashboards also help manage resources better. By showing the link between input and output, they help identify waste, such as high energy use or long idle times. Improving efficiency means using data to guide every adjustment toward a leaner operation.
Reducing Data Overload and Focus on Actionable Information
Factories generate huge amounts of data, but too much information can be overwhelming. A good manufacturing dashboard filters the noise and highlights only the Key Performance Indicators (KPIs) that matter. It organizes data so the items requiring attention stand out.
Simple visual cues, like red for critical issues and green for normal conditions, help users focus. A floor manager does not need every sensor reading; they need to know which areas show trouble. By pointing attention to what needs action, digital signage helps teams spend time fixing issues instead of hunting for them.
Types of Data and Metrics in Manufacturing Dashboards
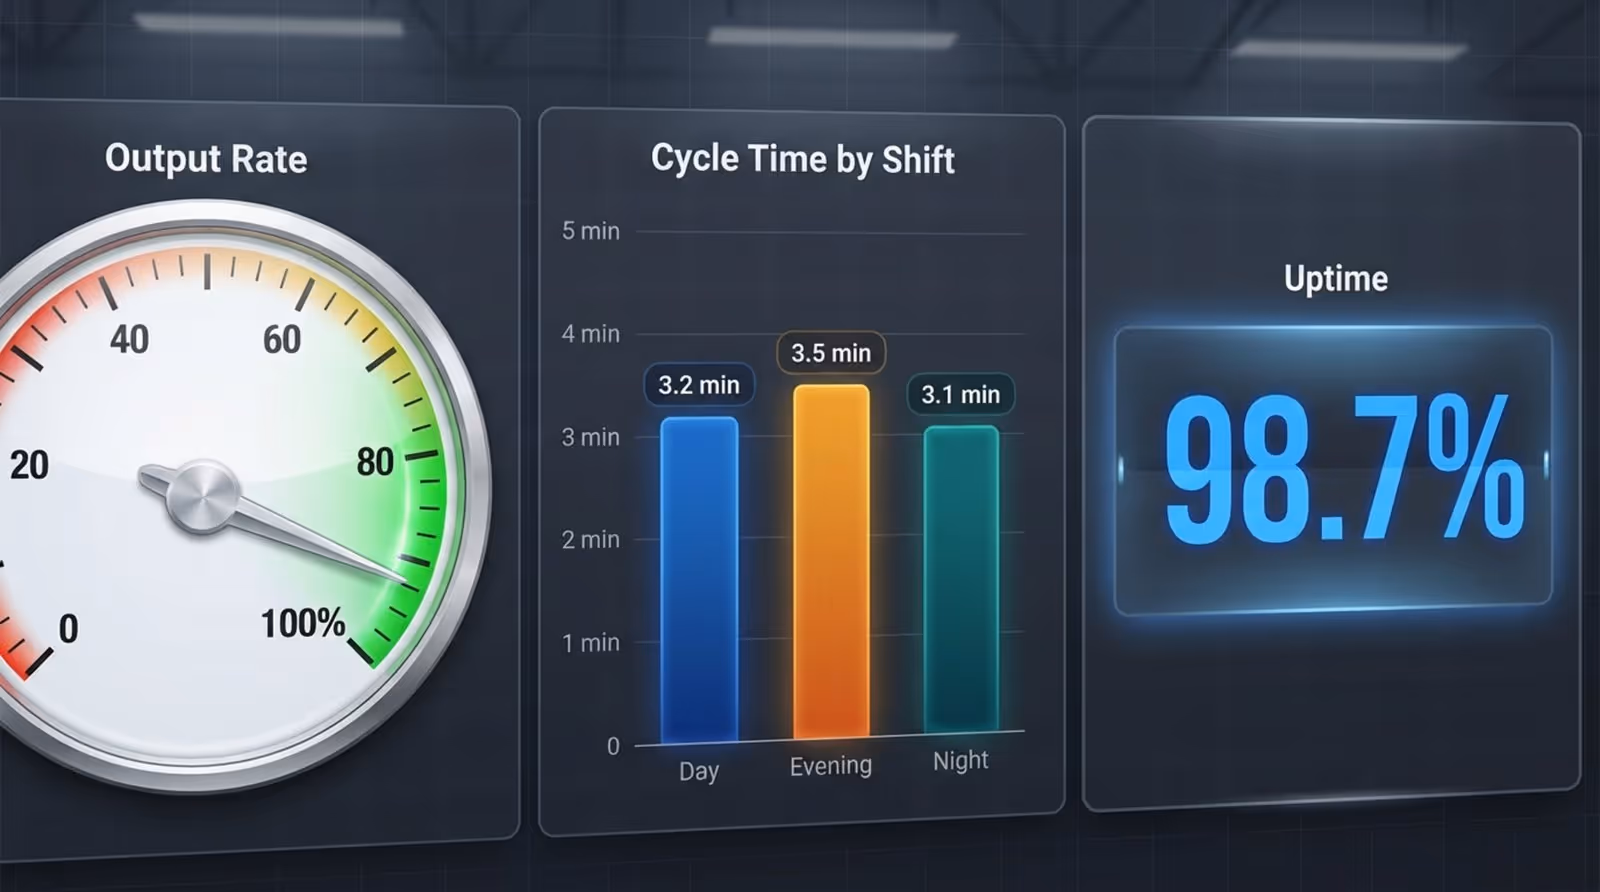
Production Metrics: Output Rates, Cycle Time, Uptime
Production data is central to most dashboards. Key metrics include:
- Output rate: The number of units produced in a set time.
- Cycle time: The time it takes to complete one process.
- Uptime / Downtime: Machine availability status.
Tracking these in real time allows managers to act early. If output drops, they can quickly check for staffing shortages or machine issues. Keeping a close eye on these numbers helps manufacturers meet customer demand consistently.
Quality Indicators: Defect Rates and Yield
Speed implies nothing if quality is poor. Metrics like defect rate and yield are vital for reducing waste.
- Defect rate: The percentage of units failing quality checks.
- Yield: The percentage of products passing on the first try.
A drop in yield is an early warning. Dashboards can tie quality shifts to other factors, such as raw material batches or specific shifts. Catching these patterns early prevents scrap and rework.
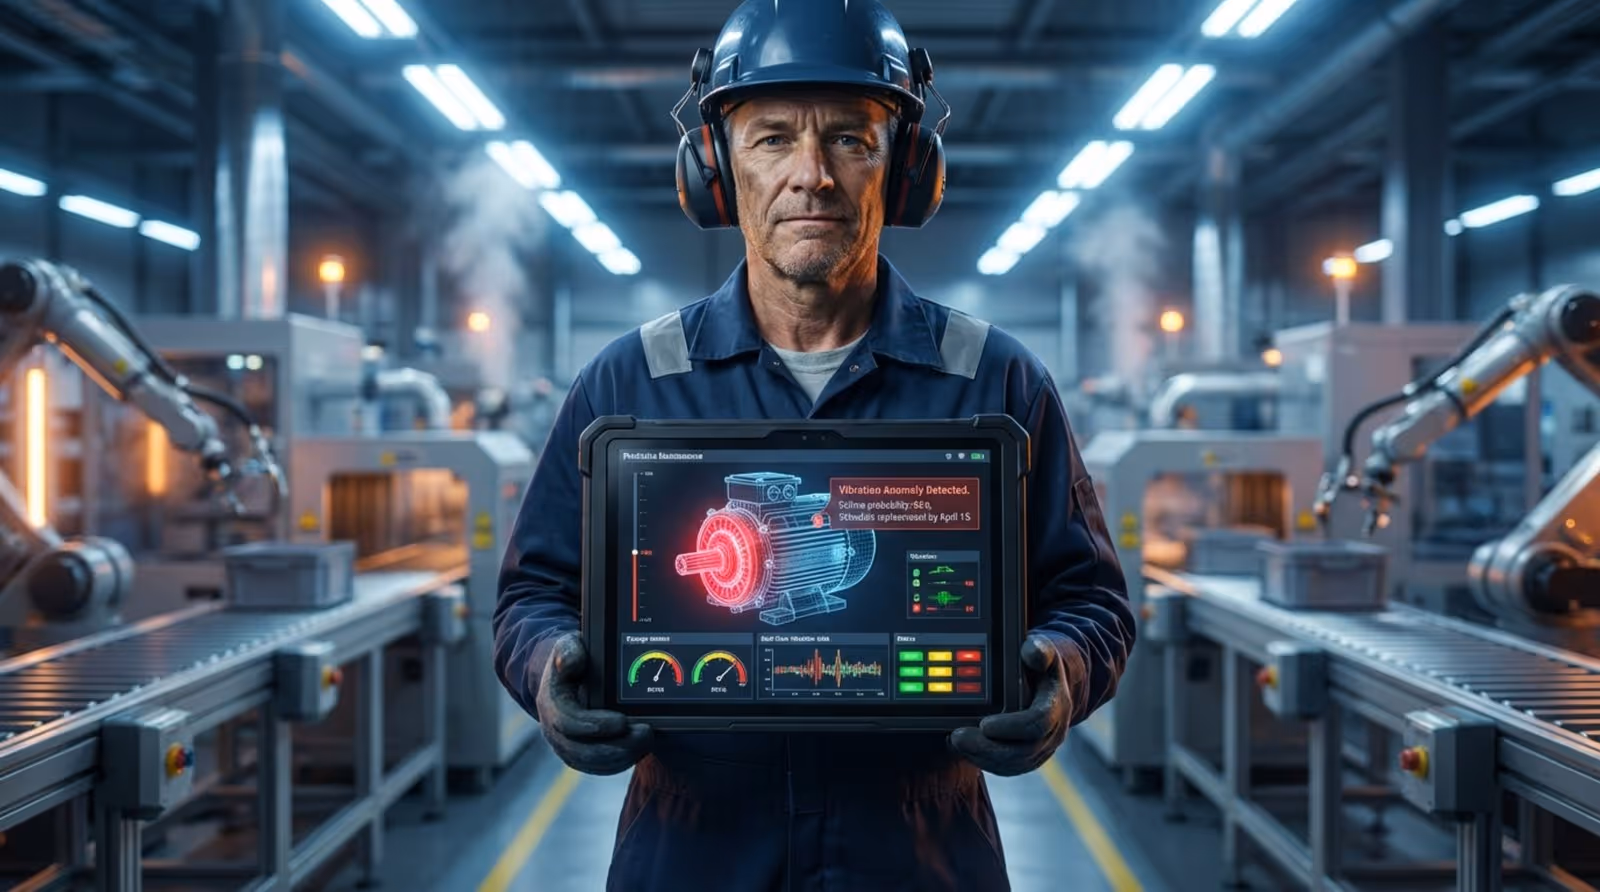
Maintenance Data: Predictive Alerts and Downtime Tracking
Modern dashboards support predictive maintenance. Sensors track vibration, temperature, and sound. If readings drift from normal, the dashboard sends an alert before failure occurs. This lets maintenance teams plan work during scheduled stops rather than dealing with surprise breakdowns.
Downtime tracking is also critical. By logging reasons for stops-such as planned maintenance or failure-plants can see what hurts output the most. This data supports better decisions about equipment replacement and maintenance schedules.
Inventory Levels: Raw Materials to Finished Goods
Inventory control balances cash flow and production needs. Dashboards show live levels of:
- Raw materials
- Work-in-progress (WIP)
- Finished goods
This detail supports Just-In-Time (JIT) production. Alerts can warn when stock falls below set levels, helping purchasing teams act in time. Tracking finished goods helps logistics plan shipping, keeping the supply chain moving.
Workforce and Safety Metrics
Factories run on people. Dashboards can track labor hours, skills, and productivity by team. These views highlight areas that may need extra training and support better scheduling.
Safety data is equally important. Dashboards can display accident reports, near-misses, and compliance checks. Visualizing safety events helps identify areas where more training or process changes are needed, ensuring output does not come at the cost of safety.
Supply Chain and Logistics Tracking
Performance depends on suppliers and delivery networks. Dashboards that include supply chain data allow manufacturers to see inbound and outbound shipments in one view. This helps manage lead times and expectations.
If a shipment is delayed, the dashboard highlights the impact on production. Planners can then reschedule runs or switch materials, avoiding the ripple effects of small delays.
Features That Turn Manufacturing Dashboards Into Actionable Tools
Customizable Interfaces for Role-Based Insights
Different roles need different data. Modern dashboards allow for role-based views:
- Executives see high-level KPIs like cost and trends.
- Supervisors see line performance and shift metrics.
- Technicians see detailed machine data and alarms.
By tailoring views, dashboards give each person only the information relevant to them, keeping screens clear and actionable.
Seamless Integration with ERP, MES, and IoT Systems
A dashboard is only as good as its data sources. It should connect smoothly with existing systems like:
- ERP for finance and inventory.
- MES for shop-floor control.
- IIoT devices for live machine readings.
These links remove manual entry and reduce errors. One shared data source keeps numbers consistent across the organization.
AI and Predictive Analytics for Proactive Decisions
Adding Artificial Intelligence (AI) turns dashboards into planning tools. Predictive analytics use data to estimate future outcomes. For example, an AI model might predict a higher defect risk based on environmental factors, prompting checks before quality drops.
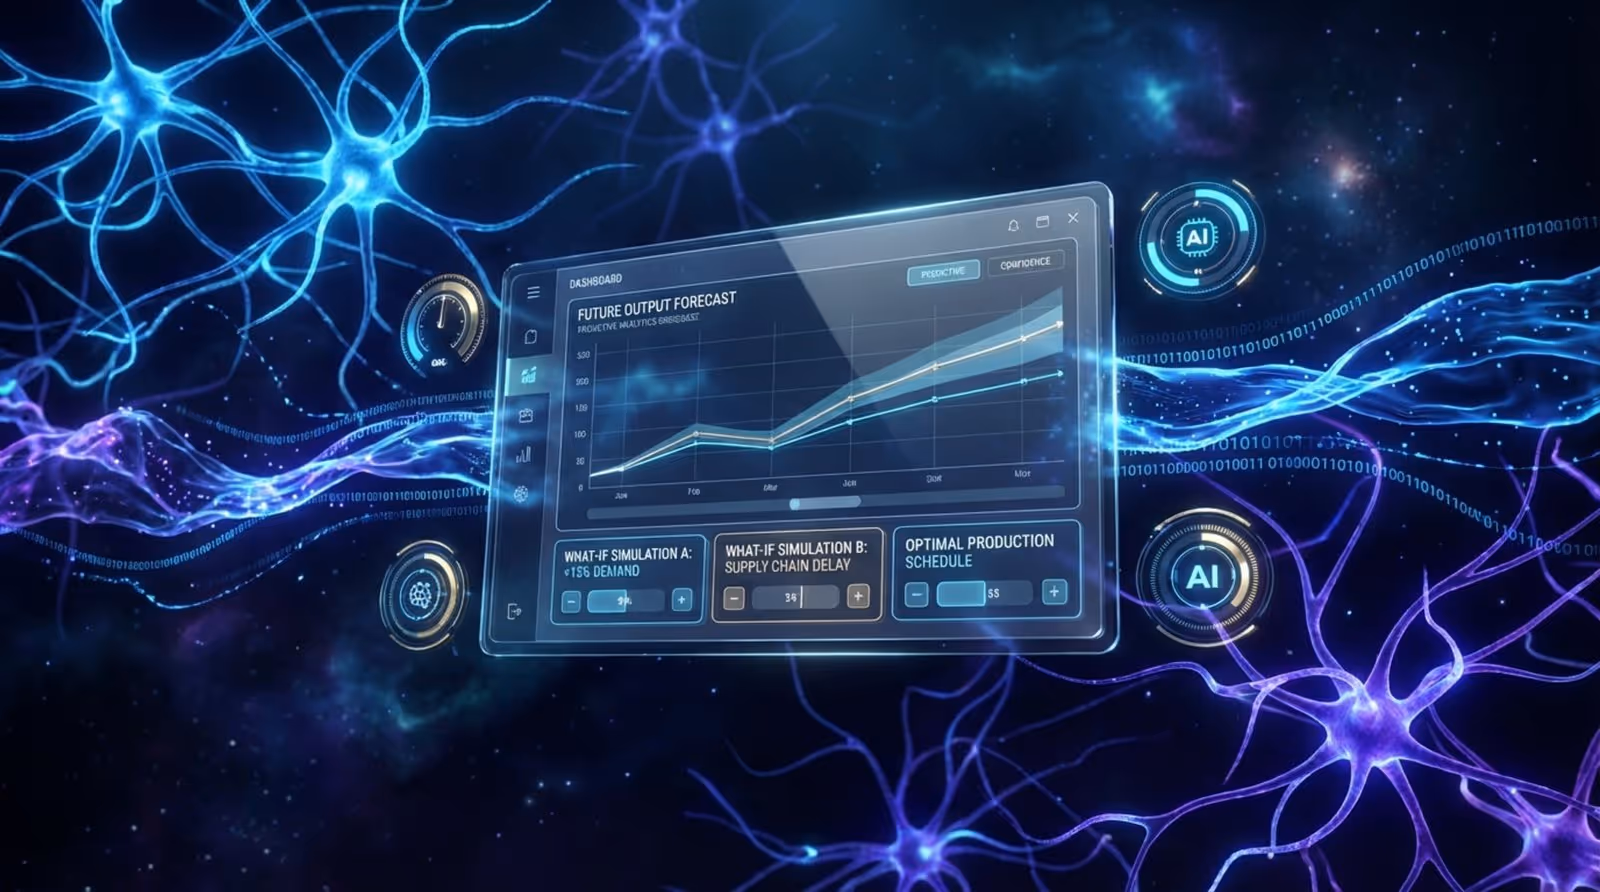
AI can also test schedule options to find the best plan for cost and output. This helps teams prevent problems rather than just reacting to them.
Automated Alerts and Notifications for Immediate Response
Teams cannot watch screens all day. Automated alerts ensure the dashboard speaks up when it matters. Notifications can be sent via email or app when key limits-like temperature or safety thresholds-are crossed.
By sending urgent info to the right people, dashboards ensure important events get a fast response.
Mobile Access Enables Decision-Making Anywhere
Managers often move between lines and sites. Mobile-friendly dashboards allow them to access plant data on tablets or phones. This keeps decision-making flowing, even when staff are away from their desks.
User-Friendly Visualizations Facilitate Adoption
If a dashboard is confusing, people will not use it. Simple visuals are key. Good dashboards use readable fonts, logical grouping, and clear icons. The goal is for users to grasp the situation in seconds. When the tool feels natural, staff are more likely to rely on it.
Security and Role-Based Permissions Protect Sensitive Data
Manufacturing dashboards show sensitive data. Strong security and role-based access control who sees what. Common protections include encryption and secure setups. This allows companies to share data internally while protecting trade secrets.
Manufacturing Dashboards in the Era of Industry 4.0
Role of IIoT and Smart Factory Integration
Industry 4.0 connects machines, systems, and people. The dashboard is the window into this "Smart Factory." As more equipment becomes smart, dashboards help turn large data flows into understandable patterns.

Enabling Continuous Improvement and Lean Initiatives
Lean manufacturing focuses on cutting waste. Dashboards make waste visible by highlighting overproduction, waits, and excess movement. They provide the "check" step in continuous improvement, measuring the impact of changes in real time.
Steps to Implement Effective Manufacturing Dashboards
Review Data Infrastructure and Readiness
Before visualizing data, ensure you can capture it. Check if machines have the right sensors and if your network supports real-time data. Cleaning data sources is a key early step to ensure the dashboard displays accurate information.
Identify KPIs Aligned with Business Goals
Choose KPIs that match your business goals. If the goal is higher throughput, focus on output rates. If it is quality, focus on defect rates. Aligning KPIs with strategy ensures the dashboard remains relevant.
Use a Reliable Platform for Display and Management
Once you have your data and KPIs, you need a reliable way to get that information onto screens across your facility. Look Digital Signage is a strong fit for manufacturing environments that need to bridge the gap between data and the workforce.
Look DS provides a simple, cloud-based platform that helps you publish dashboards to any screen in minutes. Here is how it supports manufacturing operations:
- Look CMS: Centralizes management of all your screens. You can easily schedule production dashboards to display during shifts and switch to safety announcements during breaks.
- Integrations: Look DS allows you to embed live data from tools like Power BI, Google Data Studio, or internal web-based dashboards directly into your signage playlists.
- Screen Layouts: You can create multi-zone layouts to show real-time production metrics on one side of the screen and internal news or safety reminders on the other.
- Look Player: For a quick setup, this plug-and-play hardware connects to your existing screens to ensure reliable playback of your critical data.
Train Teams for High User Adoption
Training should explain how the dashboard works and why it helps. Show staff the direct benefits-like reducing emergency repairs or hitting targets. When teams see the dashboard as a helpful tool, they are more likely to use it.
Monitor, Iterate, and Keep Dashboards Up-To-Date
Dashboards need regular updates. Watch how people use them and refine layouts based on feedback. Regular reviews help keep the dashboard a living part of operations.
Common Challenges and Solutions for Manufacturing Dashboard Adoption
Breaking Down Data Silos Across Departments
Data silos block the full picture. Using a unified platform helps break these barriers. Show teams the value of sharing data, such as better planning when sales forecasts connect to production.
Keeping Data Accurate for Reliable Insights
Inaccurate data leads to false signals. Automate data collection where possible and perform regular checks to ensure numbers match physical reality. Trust is essential for adoption.
Promoting User Engagement and Change Management
Involve staff early to reduce resistance. Let them help choose KPIs and layouts. Simple gamification, like tracking safety streaks, can also boost engagement.
Maintaining Security and Access Control
Connected systems bring risks. Protect your dashboard with VPNs, encryption, and strict access rights to keep data safe.
Real-World Use Cases: From Insight to Action on the Factory Floor
Real-Time Production Monitoring
A parts plant used a dashboard to track output. Data showed a recurring drop in production every Tuesday due to a slow shift change. Adjusting the process increased output without adding costs.
Quality Control and Defect Reduction
An electronics manufacturer linked their inspection system to a dashboard. They found defects rose with temperature spikes. Upgrading climate control reduced defects by 40%.
Predictive Maintenance and Downtime Prevention
A food processing plant used dashboards to monitor vibration. A warning alert allowed them to replace a failing bearing during a planned break, preventing a full shift of downtime.
Supply Chain Visibility and Agility
A furniture maker tracked timber shipments via dashboard. Early warning of a shortage allowed them to adjust schedules and meet delivery dates, while competitors faced delays.
Empowering Teams with Accessible Performance Data
A packaging company placed dashboards at the end of each line. Seeing live performance data encouraged teams to self-correct issues immediately, increasing engagement and reducing the need for supervision.
Key Takeaways for Smarter Manufacturing Through Dashboards
As we move forward, manufacturing and technology are becoming inseparable. Manufacturing dashboards are the tools that turn raw data into useful insight. By offering a clear, real-time view across operations, they support confident decisions and precise execution. To start visualizing your data and keeping your workforce informed, you can start a free trial with Look Digital Signage today and see how easy it is to manage your factory screens from anywhere.