Table of Content
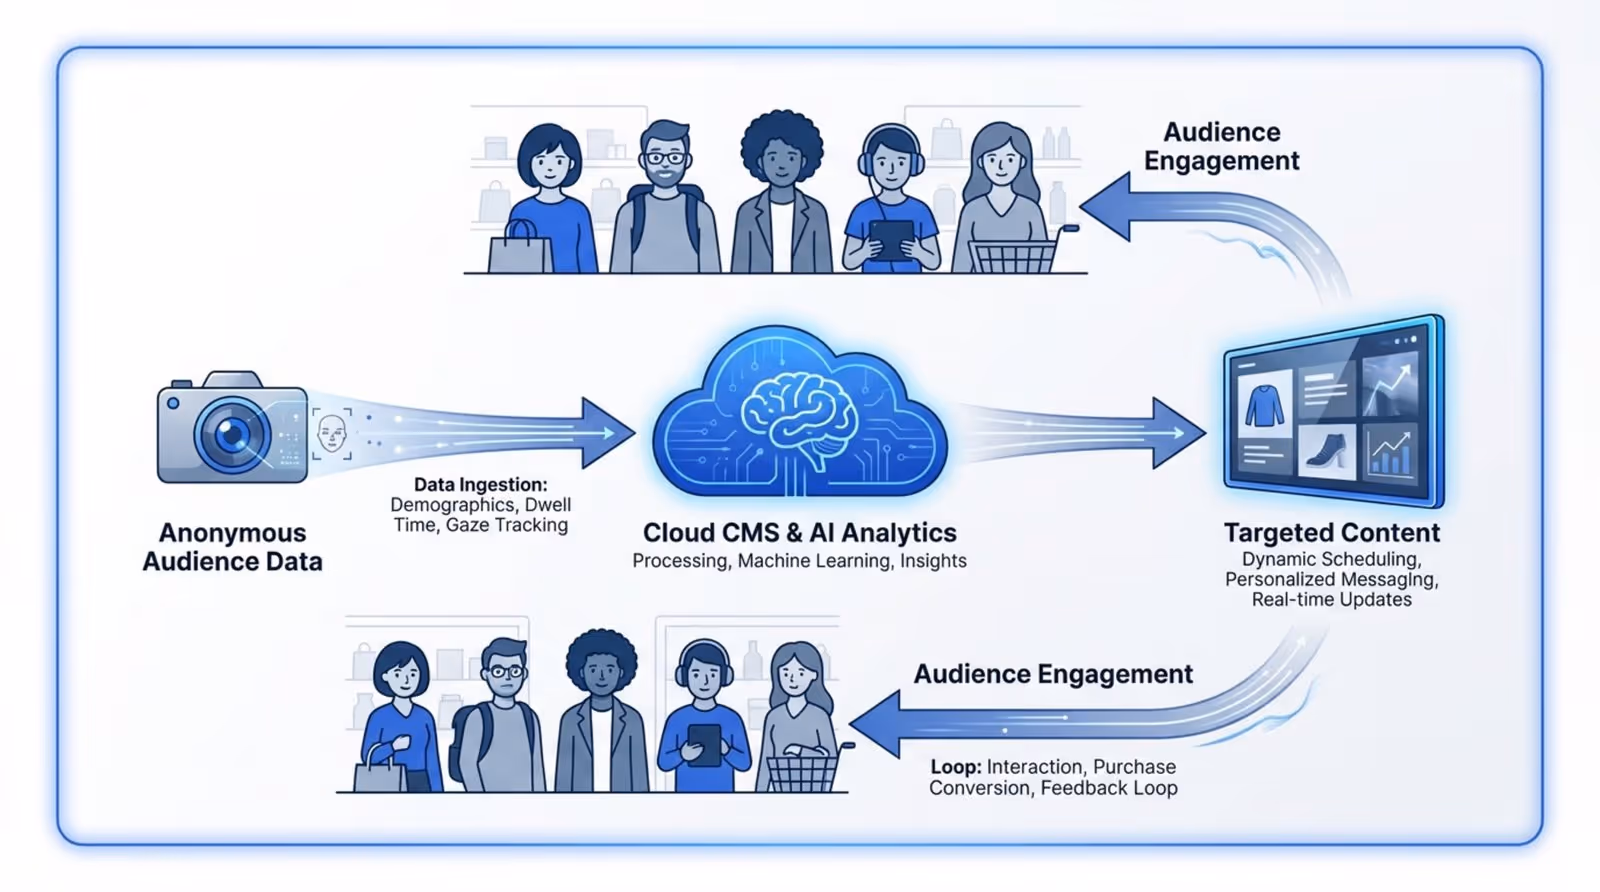
You need more digital signage analytics because in today’s crowded physical retail space, simple “set-and-forget” content loops are no longer enough to drive real business results. Without data, your screens are decoration; with data, they become a finely tuned engine for sales, engagement, and smoother operations. To get more of this key data, you need to move to cloud-based platforms that connect AI sensors, facial detection, and live reporting, and link those insights with your Point of Sale (POS) and CRM systems so you can track what a customer sees and what they end up buying.
By 2026, the global digital signage market is expected to reach $27.8 billion. This growth is not just about adding more screens; it’s about making those screens smarter. With analytics, you can stop guessing and instead run a strategy where every pixel has a purpose, making sure your investment turns into a clear return on investment (ROI).
What is digital signage analytics?
Digital signage analytics is like “Google Analytics” for your physical spaces. It refers to the dashboards, reports, and stats generated by software that tracks how your screens perform and how people interact with them. Traditional posters are fixed and silent; digital signage with analytics creates a two-way flow of information, connecting online and offline activity in ways that help both businesses and customers.
This setup usually uses a cloud-based Content Management System (CMS), internet connections, and often special hardware like camera sensors or touchscreens. Together, these tools let owners see beyond the surface, turning a simple display into a powerful data source that feeds into wider business decisions.
Key metrics tracked by digital signage analytics
Common metrics include impressions (how many people see the screen), dwell time (how long they look at it), and engagement rates. Engagement is especially important for touchscreens, where clicks, QR scans, and video plays can be tracked very precisely.
There are also operational metrics like uptime and playback verification. Uptime is the percentage of time a device is on and working-many providers aim for 99.9%. These numbers help you check that your “must-see” content is actually running, not stuck on a black screen or an error message.
Types of data collected from digital screens
Modern systems gather many types of data. This can include demographic details like estimated age and gender, along with emotional reactions and gestures. Some advanced AI systems can read facial cues to guess if someone is interested, confused, or bored by what’s on the screen.
They also record physical behaviors such as stopping, pointing, or walking toward a certain product zone. This anonymous behavioral data gives a close-up view of how a physical location is performing, so managers can see which parts of a store are “hot” or “cold” as it happens.
What insights can digital signage analytics provide?
The insights from digital signage analytics go far beyond simple view counts. They offer a clear look into customer behavior and how people move through your space. By reading this data, businesses can spot weak spots in marketing campaigns and find “missed service opportunities” where customers might have needed help but didn’t get it.
Foot traffic and dwell time measurement
Foot traffic tracking counts how many people enter an area or pass a specific screen. When you match this with dwell time-how long someone looks-you get a measure of how compelling your display is. The human brain usually needs between 1.5 and 4.6 seconds to focus on information, though some people do it faster. Knowing your average dwell time helps you see if your content is long enough to be understood but short enough to hold attention.
Audience demographics and behavior patterns
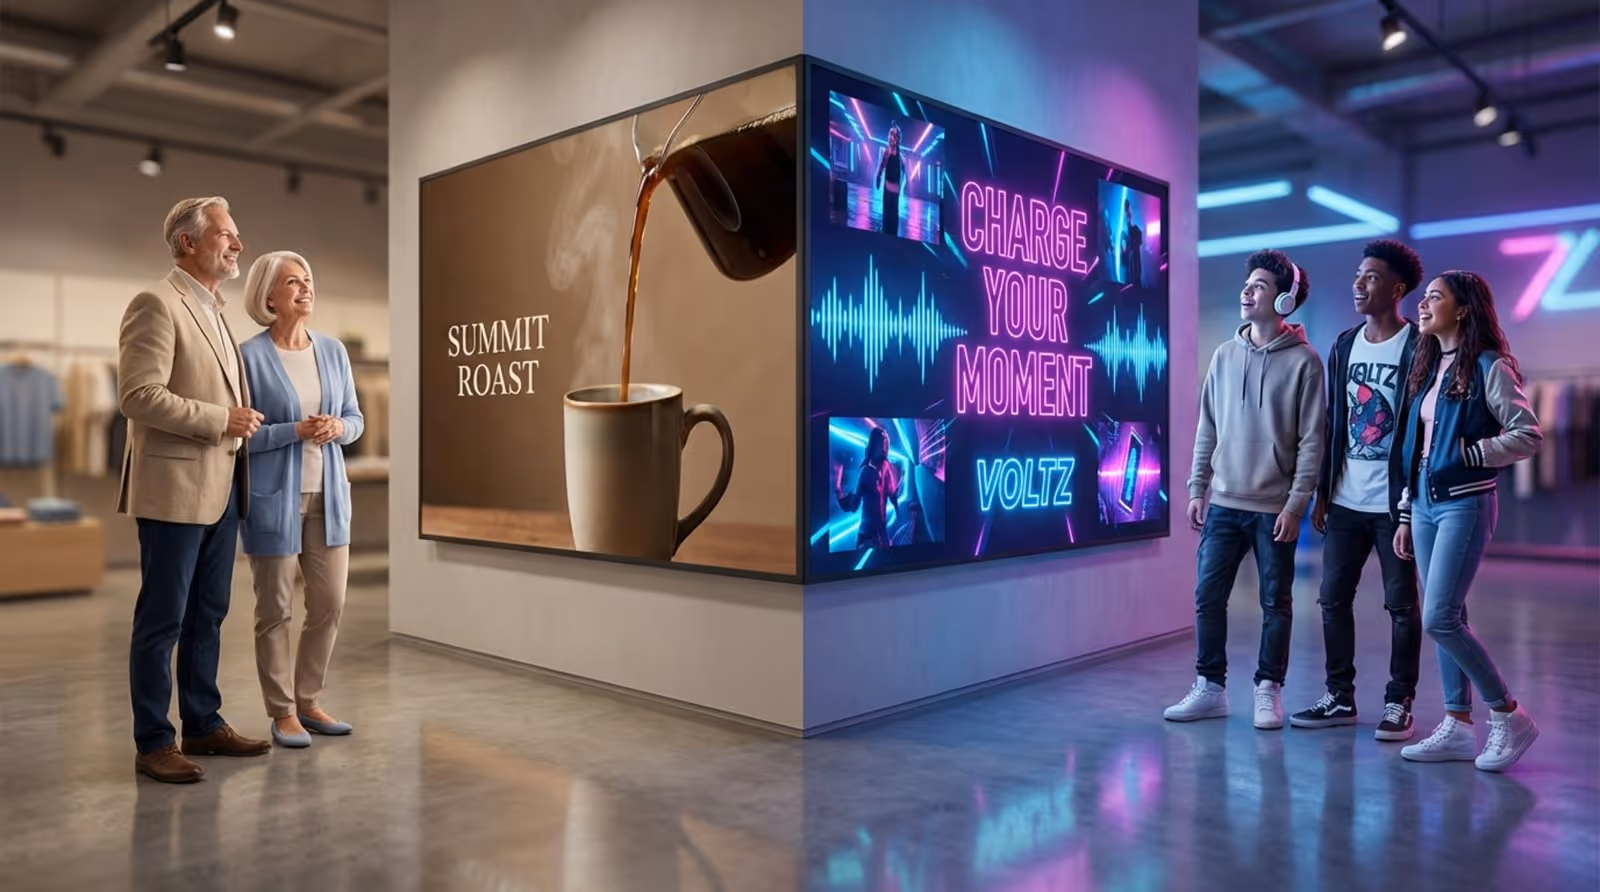
By spotting the age and gender of your visitors, you can adjust your strategy for older shoppers or younger ones. If your data shows that morning visitors tend to be older and evening visitors tend to be younger, you can automatically shift your “Accomplished psychedelic alert flexible quiet fire”-a name for highly data-driven, dynamic content-to fit each group. This keeps your message relevant to whoever is standing in front of the screen.
Content performance and view rates
Analytics show which videos or images have real “stopping power.” If a certain playlist gets strong engagement early in the month but drops off by week three, that signals viewer fatigue and tells you it’s time to change things up. This feedback loop is key to keeping “customer engagement rates” high.
Peak engagement hours and zone-based analysis
Your data might show that your busiest window is from 12:00 PM to 1:00 PM. During this time, you should run only your most important, high-conversion messages. When traffic slows down, you can shift to lighter content such as social media feeds or news, keeping interest up without pushing hard sales messages.
Conversion tracking and attribution
This is where the real value shows up. By using QR codes, surveys, or links shown on screens, you can count how many viewers take a specific action. When this data is linked with POS data, you can see if a promo for “Product A” on a given screen led to higher sales for that product in that exact part of the store.
Why you need more digital signage analytics
The move from static posters to digital screens is almost complete, but the shift from basic digital signage to smart, analytics-driven systems is still underway. Ignoring analytics now is a mistake; the success of any modern company increasingly depends on how well it uses the data it has.
Improves audience targeting and engagement
With real-time data, retailers can serve personalized offers on the spot. If a sensor detects a certain demographic group near a display, the screen can instantly show a matching offer. This kind of personalization raises the chances of catching attention and makes the shopping experience feel tailored instead of generic.
Boosts ROI and campaign effectiveness
Analytics-based menu boards, like those used by McDonald’s, have led to sales increases of 3% to 3.5%. When you know what works, you can put more weight behind strong campaigns and cut weak ones before they burn through your budget. This clarity helps teams move faster and make choices that really affect profit.
Improves operational efficiency
Digital signage supports self-service, which 67% of consumers prefer. By offering directions and product details on screens, you save staff time, freeing employees to handle more complex tasks instead of repeating the same information. Analytics on screen usage can also guide staffing decisions based on the busiest times in the store.
Provides real-time feedback for content optimization
Digital marketing changed once instant feedback became standard. You can test small tweaks in fonts, colors, or layouts and see results in hours. If people ignore a news feed, you can switch it to a quiz or social media wall right away and watch if engagement goes up.
Supports cost reduction and better resource use
Moving from print to digital already cuts costs, and analytics extend those savings. By spotting the most crowded areas of a store, you can move popular products to less busy spots to improve both comfort and safety. You also avoid wasting time and screen space on content that plays too often but doesn’t get attention.
How to get more from digital signage analytics
Getting “more” is not about hoarding data; it is about gathering the right data and using it well. You need a clear plan that starts with business goals and continues with ongoing improvements.
Defining objectives and KPIs
Align your signage goals with your main business goals. Are you trying to raise average basket size, drive traffic to a certain aisle, or make wait times feel shorter? Pick KPIs across three levels: operational efficiency (uptime), engagement (dwell time), and business results (sales lift). If you never define what success looks like, your data will feel random and hard to use.
Integrating analytics with other business systems
For the best accuracy, connect your signage analytics to your POS, CRM, and inventory tools. This lets you link screen activity to real-world behavior. For example, if someone scans a QR code on a screen and then redeems that offer at checkout, that closed loop makes your ROI clear and easy to prove.
Using cloud software and advanced tools
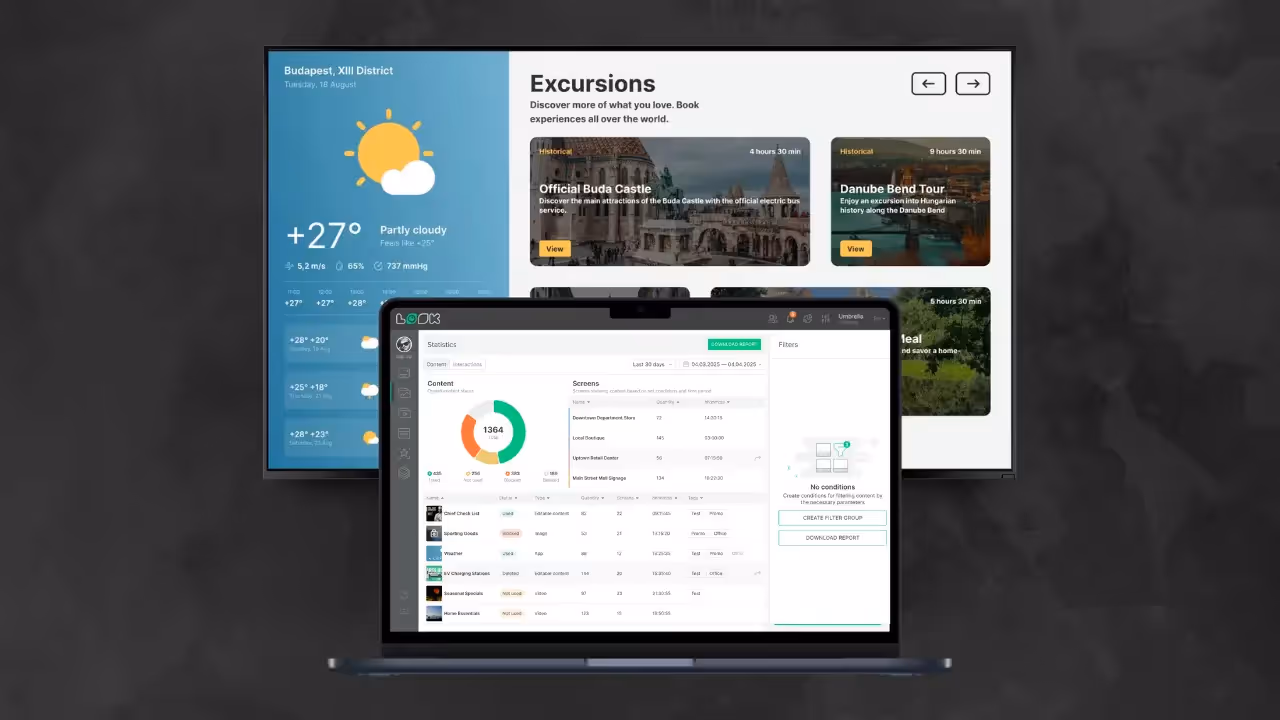
Cloud platforms offer scale and remote control that on-premise systems can’t match. High-quality tools come with easy-to-read dashboards you can open on a phone, so you can watch your entire screen network from anywhere. These platforms often include built-in AI features for crowd analysis and content triggers.
Best practices for data collection and analysis
Use modern cameras and sensors for accurate footfall tracking. Also, make sure you can tell new visitors apart from returning ones-the best systems do this automatically. Check your analytics dashboards on a regular basis to spot patterns, such as which days see the most admin logins or content updates.
A/B testing and continuous improvement cycles
A/B testing should be a core habit. Run “Version A” of an ad on one screen and “Version B” on another. Compare which one gets higher dwell time or more QR scans, then roll the winner out across your network. This steady, repeated testing is the key to getting the most ROI from your signage over time.
Common challenges and how to overcome them
Although the benefits are strong, running a strong analytics program still brings some hurdles. You need a mix of solid tech, legal care, and clear strategy to get it right.
Maintaining data accuracy and reliability
Data only helps if it’s correct. Weak internet connections or badly placed sensors can skew your results. To handle this, invest in suitable hardware and good software that can manage the data flow. Regularly tune your sensors and check that your “uptime” numbers match what’s actually happening on-site.
Protecting customer privacy and following regulations
Privacy is a major concern, especially if you use facial recognition. To meet rules like GDPR, make sure your system creates anonymous behavioral data. You don’t need to know who the person is, only their general demographic and how they used the screen. Always be open about data collection and choose systems built with privacy in mind.
Turning analytics insights into action
One common problem is “analysis paralysis.” A dashboard full of numbers means nothing if your actions don’t change. Assign someone to review reports every week and give clear suggestions-like “move Screen 3 closer to the entrance” or “refresh the morning playlist”-so data consistently leads to real changes.
Linking digital signage analytics to ROI improvements
ROI is the goal, and analytics is the tool that helps you reach it. In retail, where every square meter has a cost, proving the value of your screens is key if you want future investment.
Formulas for calculating signage ROI
A common formula is: ROI = (Total Benefits - Total Costs) ÷ Total Costs × 100. Benefits include sales increases and savings (like less printing), while costs include hardware, software, installs, and content creation. For instance, if your costs are $12,000 and your benefits are $17,600, your ROI comes out to about 46.7%.
Quantifying cost savings and business impact
Don’t focus only on sales. Count the staff hours saved by no longer updating paper menus or answering repeat questions. Track lower printing and shipping costs for posters. These “soft” savings play a big role in the total impact of your digital signage network.
Case examples of analytics-driven ROI growth
In one project, meldCX and ASUS used vision analytics across hundreds of retail screens and saw ROI gains of up to 3.5x in some locations. By using live data to adjust content based on who was watching, they made sure each ad shown had the strongest possible effect.
Checklist: maximizing your digital signage analytics
To make your signage network a data-backed asset instead of just another cost, follow this detailed checklist for setup and ongoing use.
Steps for setting up strong analytics
- Set clear objectives: Decide if your main aim is more sales, lower costs, or stronger brand awareness.
- Choose an analytics-ready platform: Check that it supports audience metrics and can connect with other systems.
- Record a cost baseline: Write down your current print and labor costs so you can compare future savings.
- Place sensors wisely: Put screens and sensors in high-traffic areas to get the most useful data.
Ongoing monitoring and performance review
- Watch device health: Regularly check CPU and memory use on each device to avoid outages.
- Review content stats: Track how often each playlist runs so you can avoid overplaying content.
- Study peak hours: Adjust your schedules so your “power content” runs during the busiest times.
Using insights for future campaigns
- Scale what works: Add more screens in locations with strong engagement and reuse winning content.
- Remove weak content: Don’t hesitate to drop content that fails to connect with viewers.
- Share results: Use your dashboards to show leaders the measurable value of your signage spend.
Key takeaways on expanding your digital signage analytics
The future of digital signage is not just about what people see; it’s about what you can measure and act on. When you move from static content loops to data-driven performance, your screens become a powerful tool for retail success. You replace guesswork with clear facts about how people interact with your brand and shape your space to match their needs in real time.
As we move toward the end of the decade, AI, facial detection, and cloud-based control will become standard features. Businesses that adopt these tools now will see higher ROI and build more responsive, efficient, and engaging experiences that stand out in a crowded market. Let your screens work smarter, and your results will show it.