Statistics
To get to the statistics screen, click on the pie chart icon in the upper navigation bar.
In the Statistics section, you can track content and screen usage for a selected time period or based on chosen filter parameters. This helps analyze activity, manage playlists and content, and identify unused materials.
Main Blocks
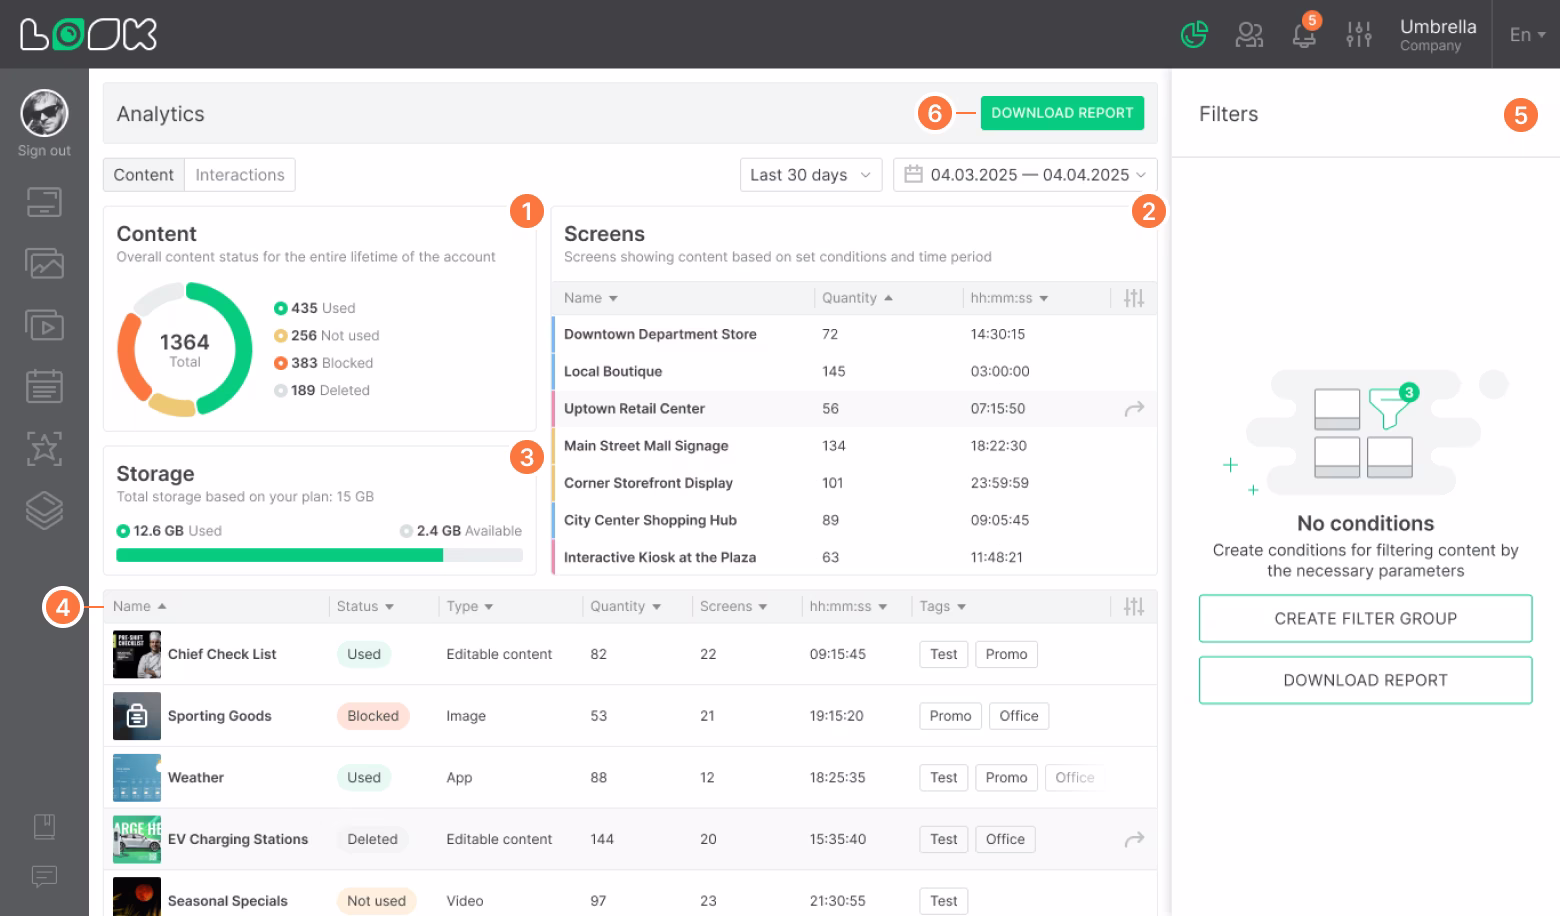
1. Content
Shows the overall status of all content in the system:
- Used — currently displayed on screens.
- Not used — added but not being played.
- Blocked — content is blocked.
- Deleted — removed from the system.
2. Screens
A list of screens showing the amount of played content and total playback time. This makes it easy to see which screens are most active and which are less used.
3. Storage
This block shows how much space is already used and how much is still available under current plan.
4. Content Table
Below the charts, you’ll find a list of all content items with additional details:
- Name
- Status (Used, Not used, Blocked, Deleted)
- Type (video, image, app, etc.)
- Number of times the content was played across all screens
- Number of screens where it’s used
- Total playback time
- Content tags
5. Filters
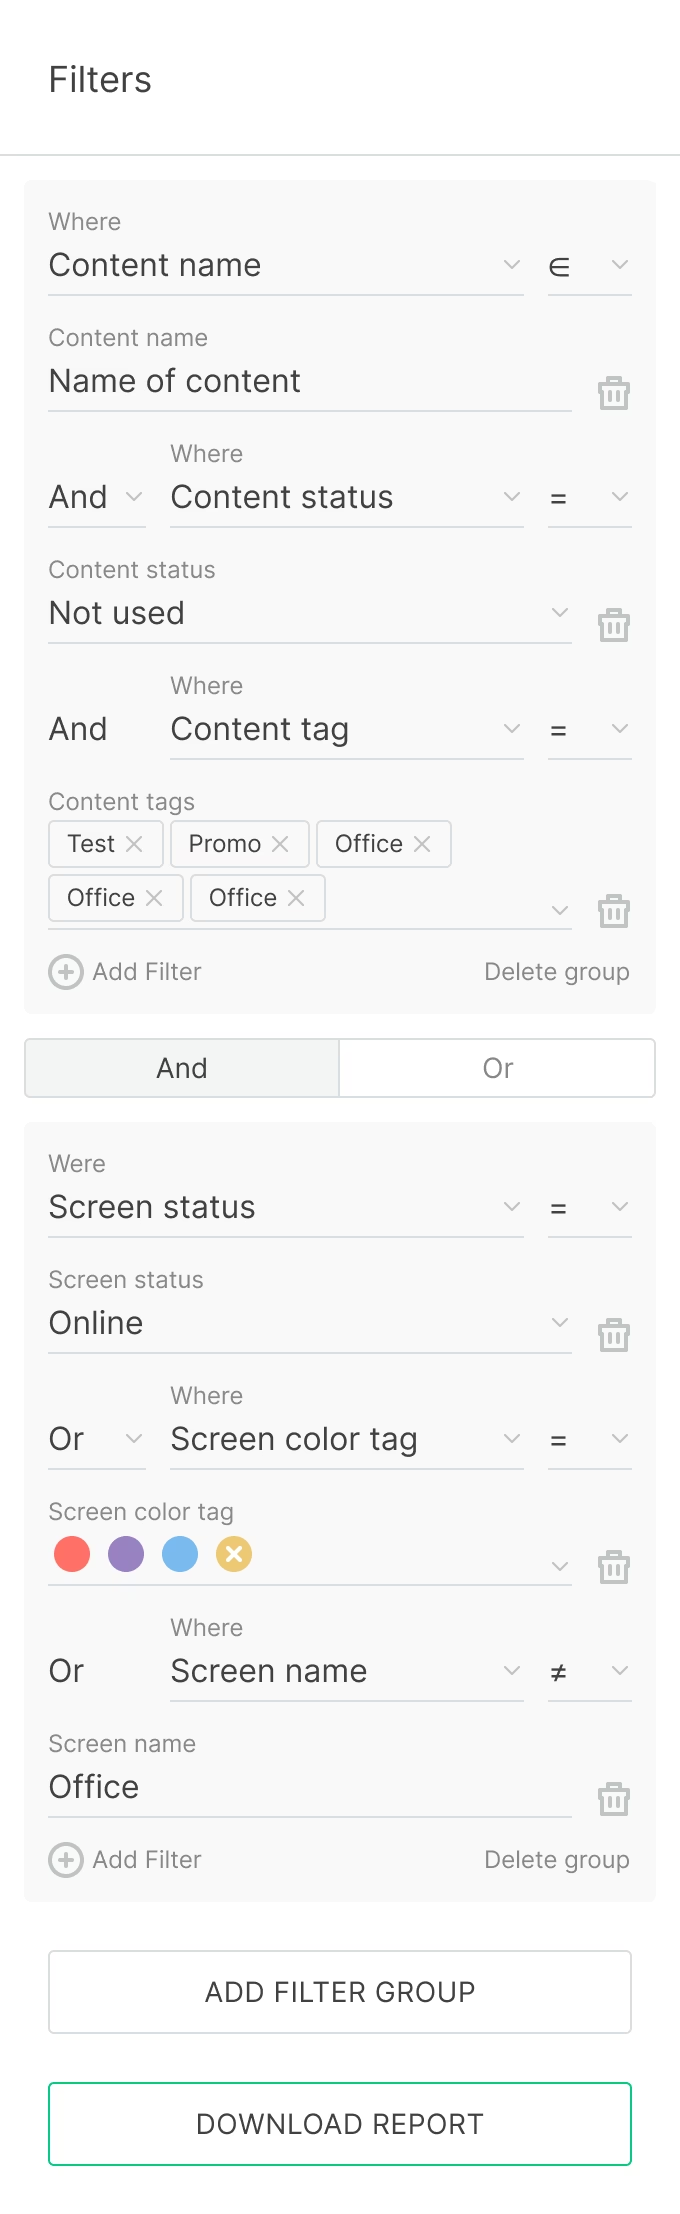
In the right sidebar, you can customize filtering with flexible options:
- Content name
- Content status
- Content type (e.g., Video stream, Image, App)
- Content tags
- Screen name
- Screen status (Online/Offline)
- Screen tags
- Screen color tags
Filters can be combined and grouped to help you find the right data faster.
6. Reports
In the top navigation panel, you’ll find the Download report button. Use it to export data for a selected period (e.g., the last 30 days or specific dates).


